
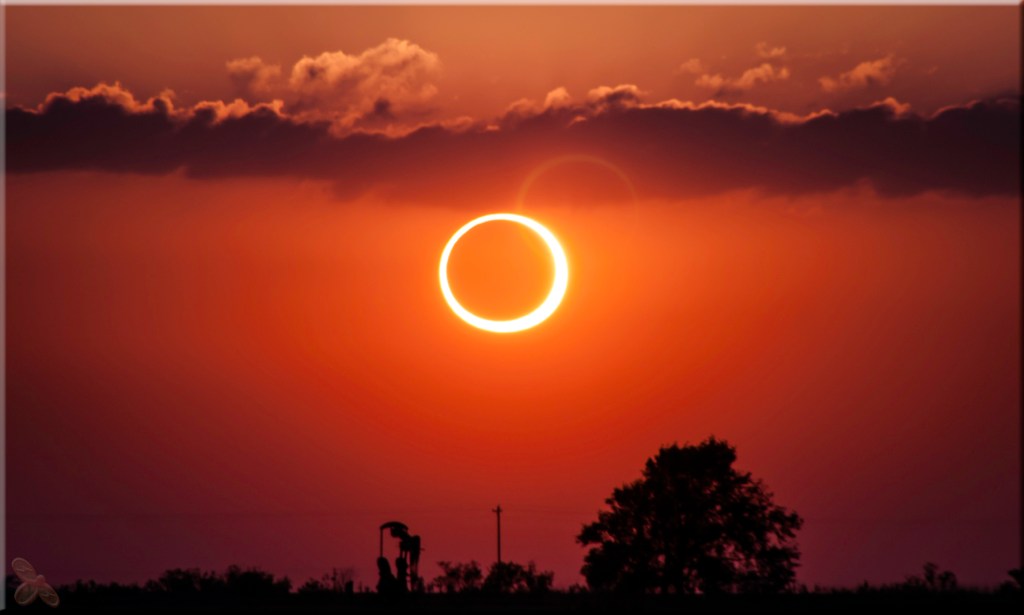
Have you ever looked at the sun, and seen something like this?
Now, before you decide to look at it right now and see what you see, it’s my responsibility as an amateur astronomer to remind you of the safety risks. Focusing your eyes on the sun is dangerous — there’s a reason our eyes automatically flinch away.
How dangerous, you ask? Dangerous enough to burn and even scar your retinas, permanently damaging or even destroying your vision.
Yes, I’m serious.
Now, all this is not to turn you off solar observing entirely. There are safe — and cheap — ways to look at the sun, and see its spots.
But what exactly are sunspots?
Here’s a more up-close and personal view of a sunspot. They’re a bit more complex than they look in a normal image of the sun.
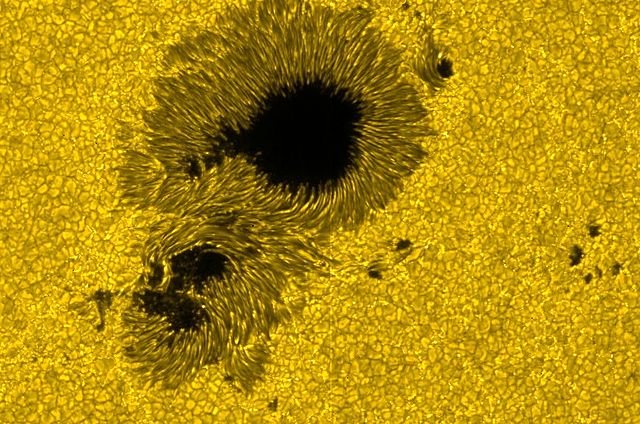
Sunspots are relatively dark regions of the solar surface (photosphere).
But…wait. What do I mean, relatively dark?
Well…here’s a fun fact for you. Imagine that you could take away the sun, but keep the sunspot. It would be brighter than the full moon.
Yes, I’m serious.
Sunspots are about 4200 K (3927℃, 7100℉). In contrast, the photosphere is about 5800 K (5527℃, 9980℉). Sunspots themselves may be extremely bright, but they don’t hold a candle to the brilliance of the photosphere. That’s why they look so dark.
So…how come there are random regions of slight dimness on the solar surface?
There aren’t. Like most things in science, there is a pattern — we just have to look for it. And the astronomer E. Walter Maunder of Greenwich Observatory figured it out.
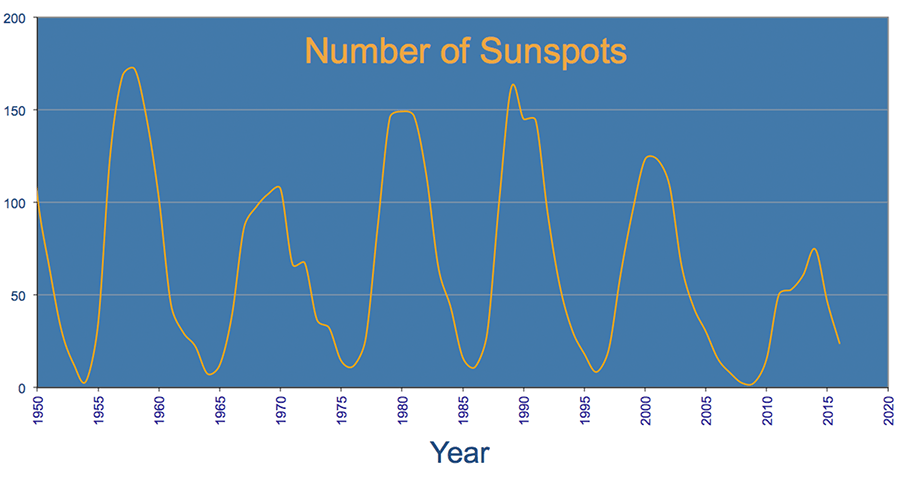
What you’re looking at here is a graph of the number of sunspots observed each year. Years are on the horizontal axis; sunspot counts are on the vertical axis. And you can see there’s a definite pattern.
If you examine the graph more closely, you’ll find that there are sunspot cycles of eleven years. Early on in the cycle, we see sunspots at higher latitudes on the sun — closer to the poles. Later on, we see them closer to the sun’s equator.
This diagram even has a special name. Want to venture a guess at what it is?
Yup, you guessed it — it’s the Maunder butterfly diagram.
You can see how this graph makes sense. Look at the year 1880, for instance. See how the sunspot data points are plotted at more northern and southern latitudes? But then if you look at the data just before 1890, the data is all plotted very close to the equator.
The butterfly shape is just a coincidence. And again, you can see the 11-year pattern. Every 11 years, we repeat that same cycle of sunspots.
Well…not exactly the same cycle. There are some distinct differences. But I’ll explain that in my next post, when I talk about the sun’s magnetic field.
Wait a second…what about the magnetic field? What does that have to do with anything?
Well, believe it or not, that’s why sunspots form.
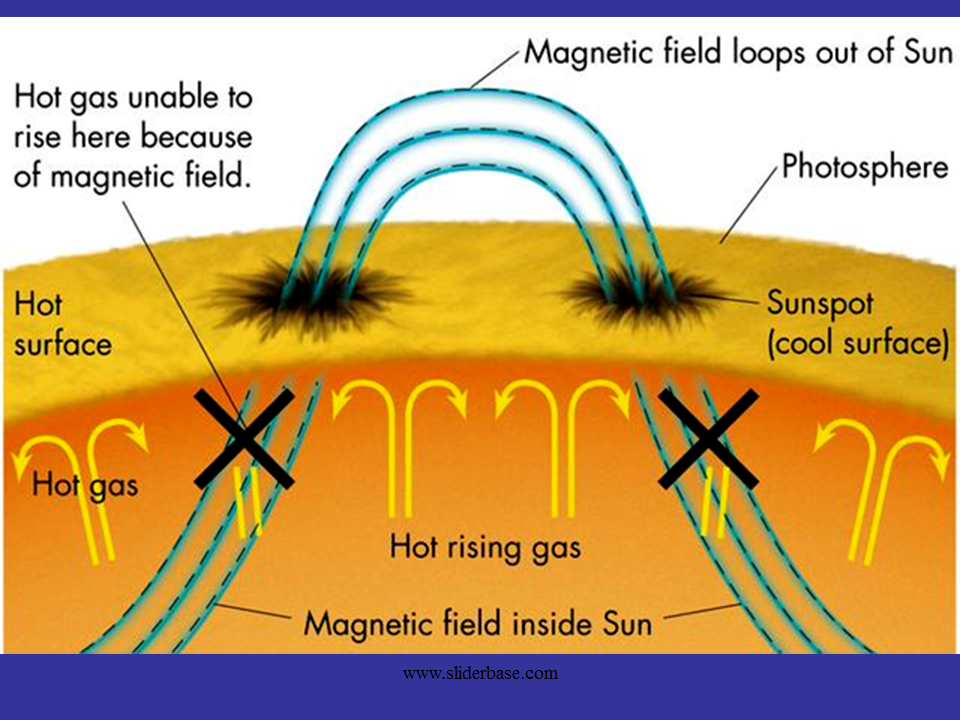
It’s not certain, but scientists believe that sunspots are evidence of the sun’s magnetic field poking up through the photosphere.
Magnetism is as strong as it is mysterious, especially when we’re talking about highly mobile gases. And when magnetic field lines poke up through the photosphere, they trap the sun’s hotter gases below, preventing them from rising all the way up.
What exactly does that mean? If that hot gas can’t make it to the surface, those regions of the surface will appear a bit dimmer. In fact, they’ll appear a bit like…well, a sunspot.
So…how do we even know the sun’s magnetic field is involved? I mean, it’s not like we sprinkled iron filaments on the sun to see what shape they made…did we?
Nope, we didn’t. But we can use what we call the Zeeman effect to our advantage instead.
To understand the Zeeman effect, it’s important to understand a stellar spectrum. I’ve written several posts these in the past, but here’s a quick review.
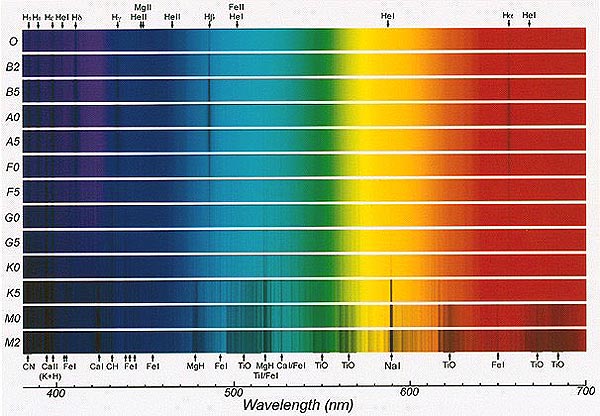
What do you think you’re seeing here?
It’s true that you’re looking at a rainbow. Very much so. What you might not realize is that each color of the rainbow has a different wavelength — that’s what makes the different colors in the first place.
What do I mean by “wavelength,” you ask? Well, visible light is just one form of radiation, and radiation exists in waves — shaped just like the ones you find in the ocean. The wavelength is the distance between crests of the waves.
You can tell what any object in the universe is made of because its atoms — its materials, essentially — interact with those waves.
Either the materials in the object are only emitting certain wavelengths, in which case the bright lines on the spectrum tell you what’s in the object, and you get an emission spectrum…
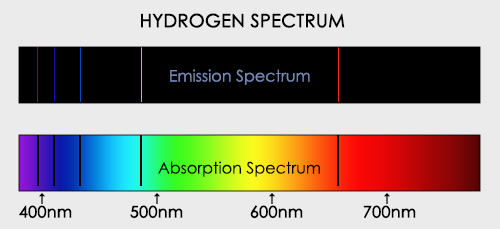
…or you get an absorption spectrum, in which case the object’s materials are blocking certain wavelengths, and you can tell what materials they are by which wavelengths are blocked (and appear as only a dark line where color would otherwise be).
The Zeeman effect deals with the sun’s spectrum. For reference, here’s how the sun’s spectrum normally looks.
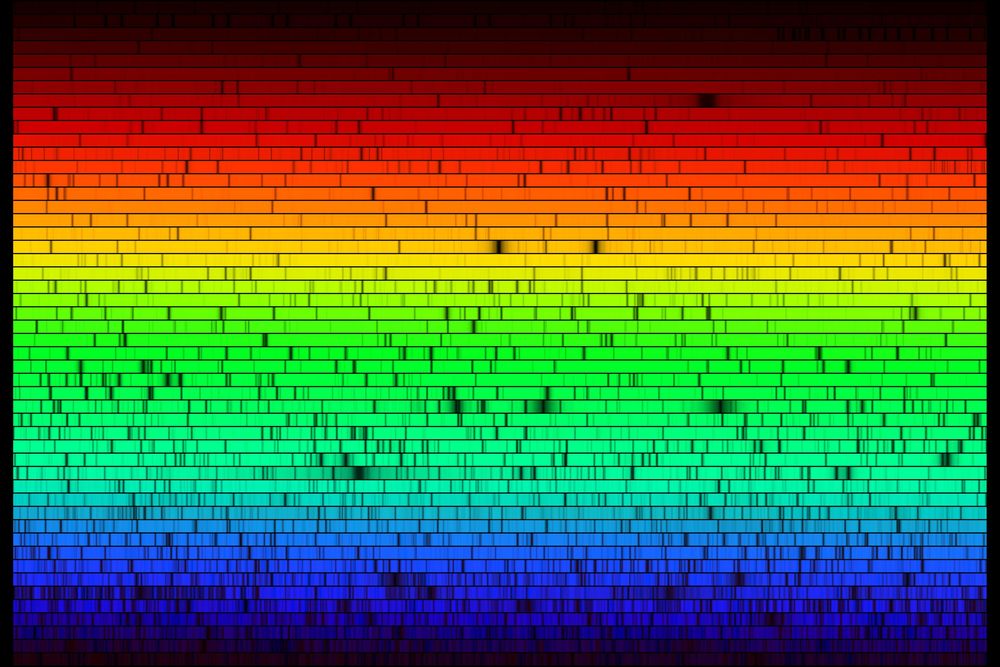
Notice how all these lines are very dark and precise? They don’t get wavy, or split, or do anything remotely unusual…
…unless we take a spectrum of gases that are trapped in the magnetic field.
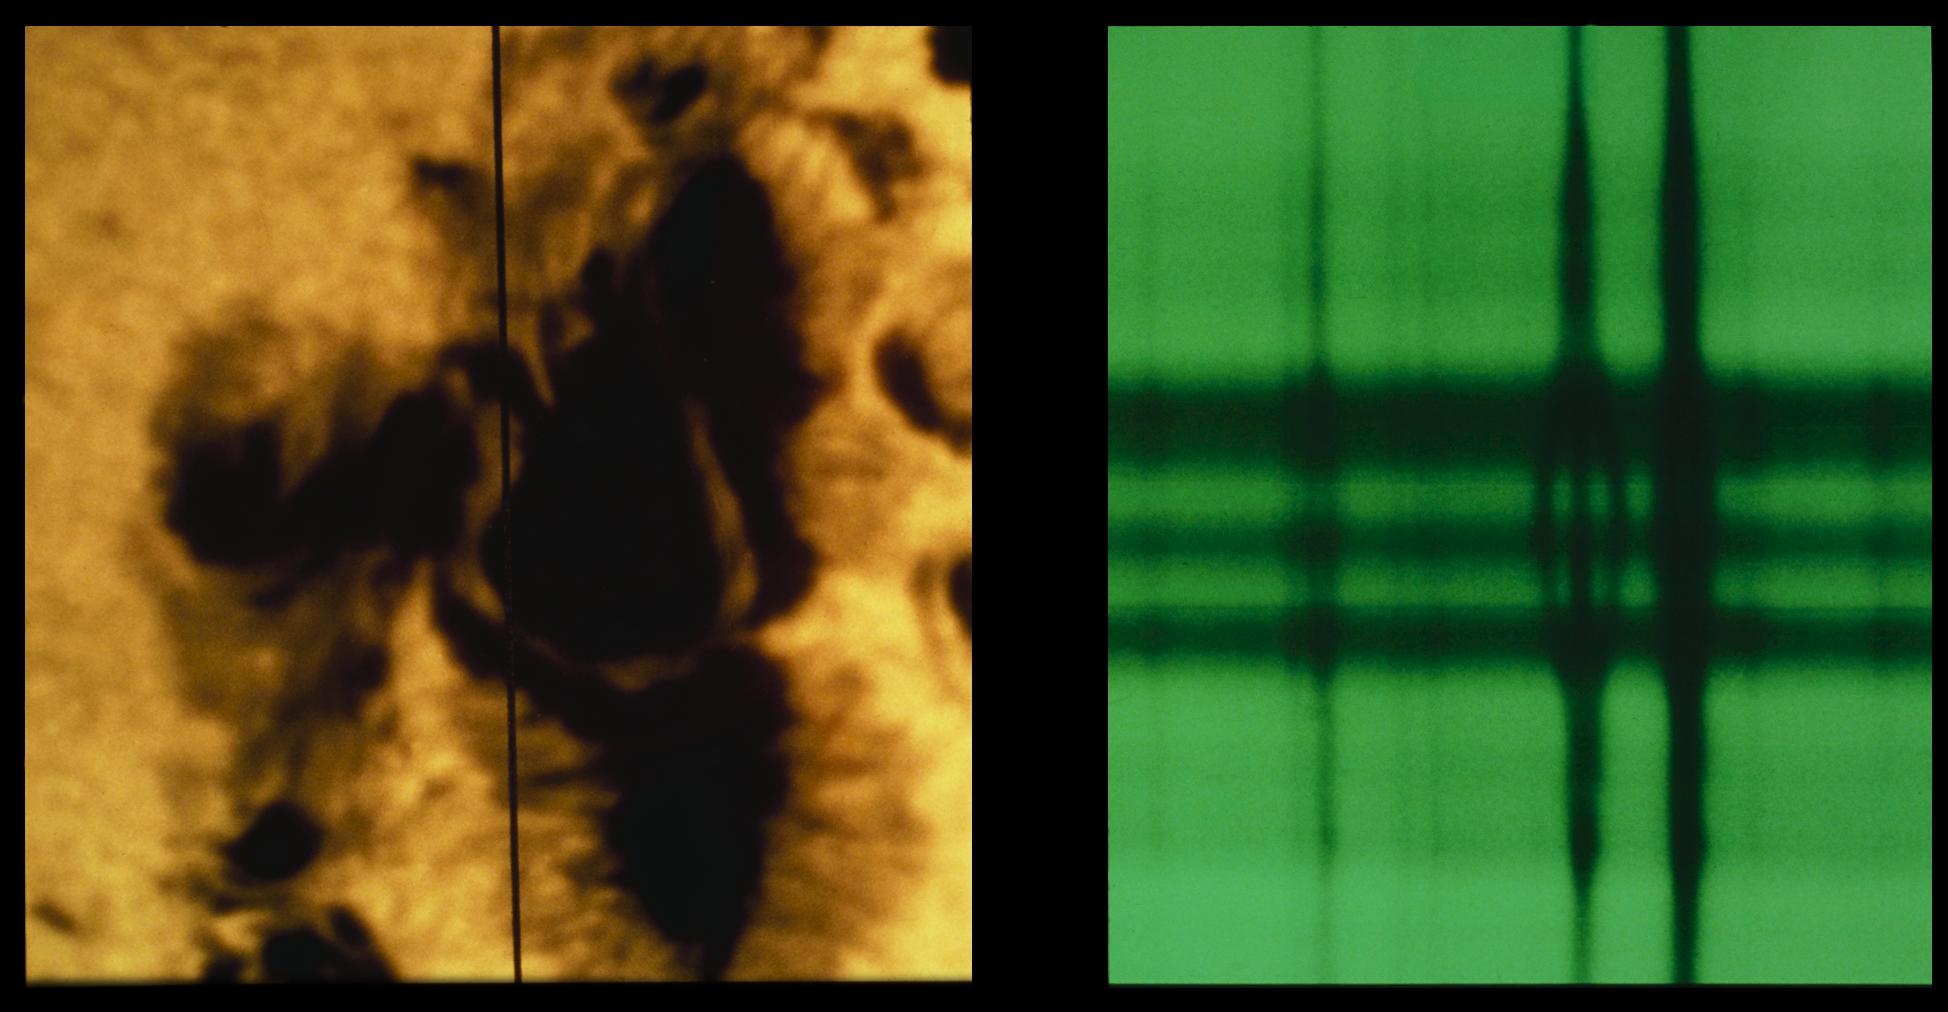
Here’s a spectrum taken of one single sunspot. Notice what happened?
Take a close look at the spectral lines on the right. Are they precise and straightforward? Or are they a little…split? Like they’re plucked strings and we’re seeing triple?
(Seriously, though, doesn’t it look a bit like a plucked string?)
Okay…what is happening here?
Atoms do something funny when they get caught in a magnetic field. Instead of blocking (or emitting) light at specific wavelengths, they get their capabilities expanded a bit. They’re able to create multiple spectral lines where, before, only one existed.
And this is how we can tell that the magnetic field is unusually strong in sunspots. We can then conclude that it’s trapping hot gases below, creating these slightly cooler regions on the sun’s surface.
I’ll bet you’re wondering when I’ll finally get around to sharing my secrets about observing the sun. Don’t worry — I’ve got a few for you.
First: As an amateur astronomer who hangs out with amateur astronomers, I’d be remiss not to mention our cool toys. Below you see a Coronado, a telescope made specifically for viewing the sun.

If you’ve already got a quality telescope and don’t want to spend money on a Coronado, you can always go for a cheap astronomer-style upgrade and get a solar filter.
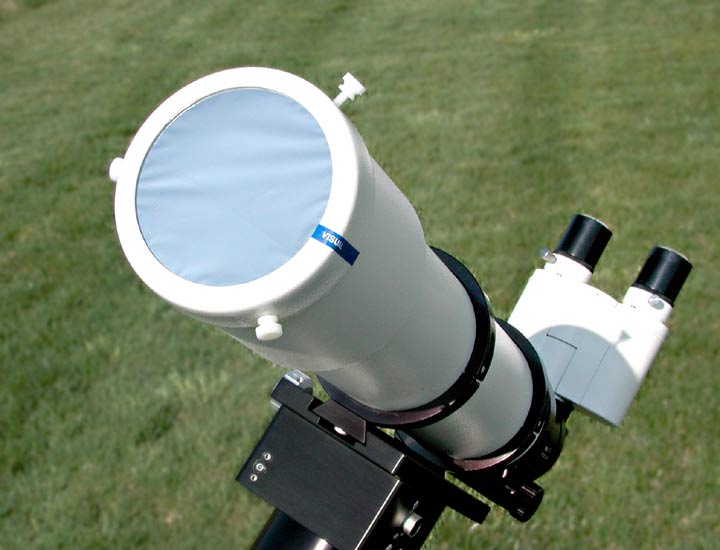
The filter is the white ring thingy tacked onto the end that points at the sky. Let me be clear here — if your telescope is NOT specifically a solar telescope, do NOT look at the sun through the eyepiece.
A solar filter can cost between $20 and $70 if you’re going for the cheap range, and it’s a good upgrade for an already-expensive scope.
If, on the other hand, you’re thinking of something that’s more on the cheap side, but still quality…I’d just recommend just buying a cheapie telescope. Seriously. Get the kind you don’t show off at astronomy club meetings. And get a big white sheet of paper.

I’m serious. It works. And it’s cheap. I mean, you’ll get a better image out of a better quality telescope, but if you really want to go cheap, this is the strategy for you. You’ll still be able to see sunspots in all their magnetic glory.
This post has only scraped the surface of the intricacies of the sun’s magnetic field. Next up, we’ll explore it in all its complexity.


Leave a reply to Simon Cancel reply