

Would it surprise you to hear the solar eclipses repeat?
Now, I know we can’t go back in time to see past eclipses, and once the date of an eclipse — say, March 7, 1970 — has passed, that date will never come again. It’s simple reality, and we’re all aware of time’s passing.
But as you’ll soon realize through these astronomy posts, astronomy is full of repeating cycles. And one of those is the saros cycle, or simply the “saros.” It’s an eclipse prediction cycle, and after every one, the same eclipse occurs again.
But how?
You may be aware that in order for a solar eclipse to happen, the moon has to be in its “new” phase, meaning it’s silhouetted between the Earth and the sun.
The moon has to be new for a solar eclipse to happen.
It’s possible for one to happen anytime the sun is also near the new moon in the daytime sky. The moon is new once every lunar day, but the sun isn’t necessarily nearby — that takes 346.6 days, also known as an eclipse year.
Have you ever had to add fractions together that don’t have the same denominator?
Chances are you have. And you know that you need to find the “least common denominator” so that the fractions remain equal, but with the same denominator.
This “LCD,” as it’s often called, is found by multiplying both denominators a few times until they both reach the same number.
For example, to add 1/2 to 1/3, you’ll find that 6 is the first multiple they have in common.
The same works for finding out when a lunar day and an eclipse year coincide.
After exactly 223 lunar days, there have been exactly 19 eclipse years. This time period is 6585.321 Earth days long — 18 years and 11.3 days — and it’s what we call a saros cycle.
At the end of each saros cycle, the moon hasn’t just returned to the new moon phase — the sun is also right near it in the sky. And this is when an eclipse absolutely will happen. It will repeat almost exactly as it did 18 years and 11.3 days ago.
But the eclipse doesn’t repeat in exactly the same place around the globe…
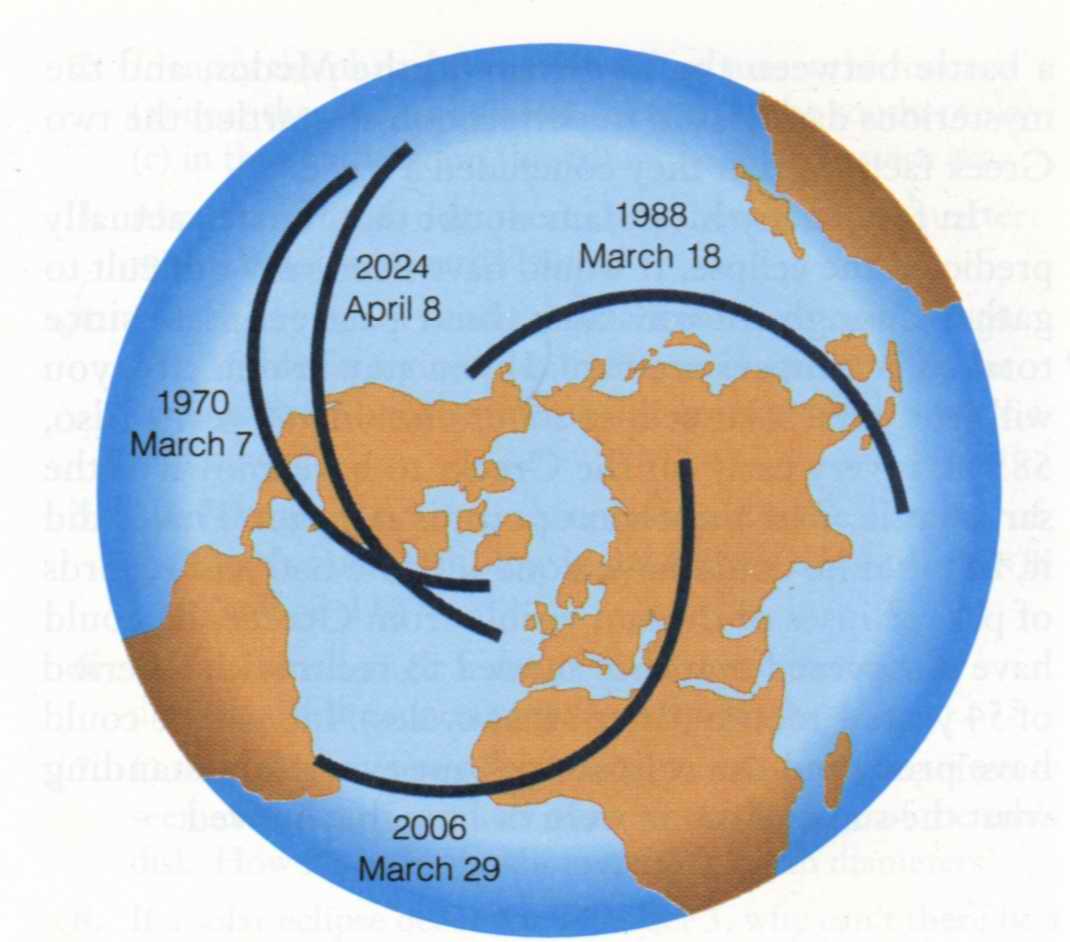
This diagram shows the path of totality — the path the moon’s shadow traces across the Earth — of the same eclipse, each seen 18 years and 11.3 days apart in different regions of the globe.
It’s seen in different places because the saros cycle is one third of a day longer than 18 years and 11 days. That means that Earth has rotated just one-third of the way around by the time the eclipse happens again, and it will be seen one-third of a rotation farther westward.
Notice how far in advance the saros cycle lets astronomers predict eclipses. We know for a fact that since one happened on March 7, 1970, and again in 1988 and 2006, it will happen again in 2024 — and now it will be in about the same spot it was in 1970.
Wait a second…how do we know that?
Well…remember that a saros cycle caries an eclipse one-third of the way around the globe when it happens again. So after three more saros cycles, the eclipse will be carried three thirds of the way around — which is all the way back where it started.
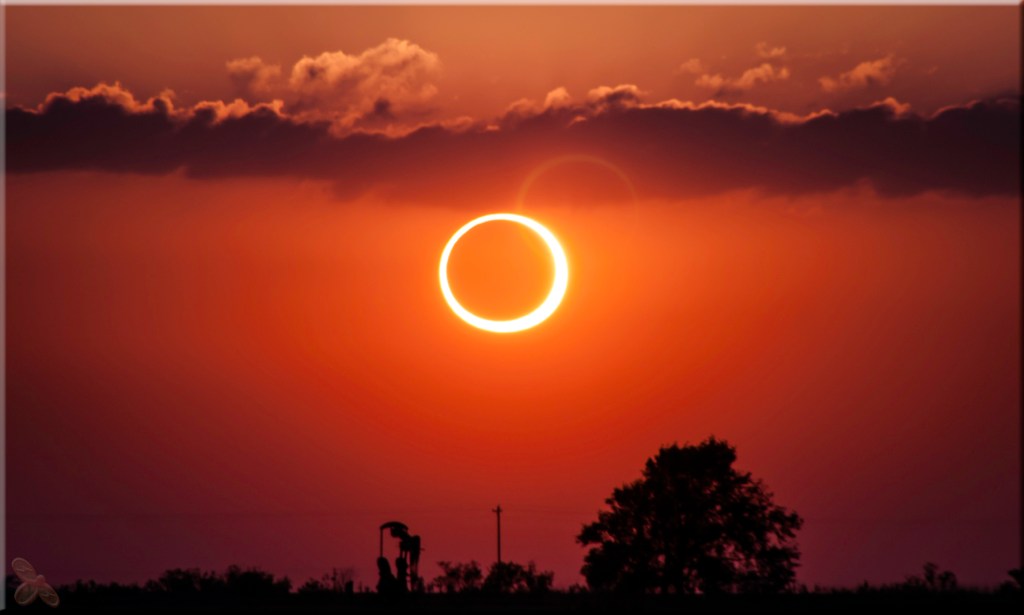
That’s how astronomers know that there will be another total eclipse over the United States on April 8, 2024, seven years from now. And believe me, I’ll be covering that one in depth.
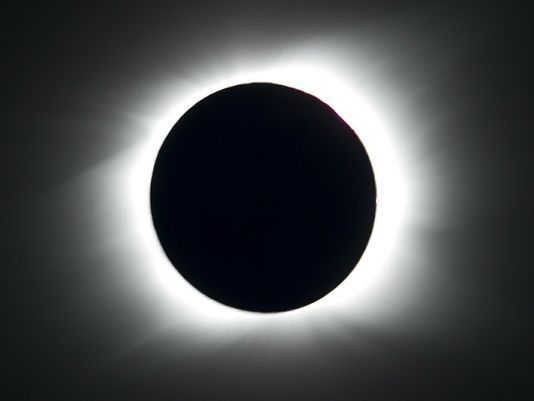
I’ll remind you of the safety warnings as the date grows near, as well as enticing you with images of the beautiful diamond ring effect. Maybe I’ll even update you live from the path of totality — and in that case, you’ll see photos pop up on Facebook or Twitter!
But please, oh please, don’t miss totality just to look at my shots of it. If it’s in any way feasible for you to see it yourself, go see it yourself! And spend those few hours with your eyes glued to the darkening sky, not to your phone screen. You don’t want to miss it.
Naturally, an astronomer’s best ally is math — because without knowledge of math, we couldn’t have figured out the length of a saros cycle from the lunar day and eclipse year. We’d be remiss if we didn’t demonstrate saros cycles graphically.
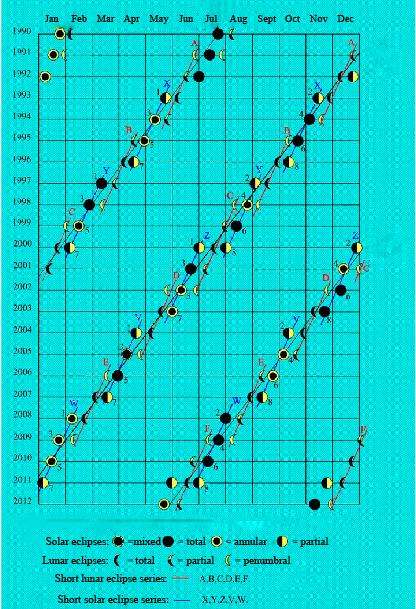
Sorry about the quality of this image — it was in French, I photoshopped the words out and then translated them all with Adobe Illustrator. And then it wouldn’t convert to a jpeg, so I just took a screenshot and blew it up again. That means everything’s just a slight bit blurry…
But I hope you can get a good idea of what this graph is trying to show. On the vertical axis, we see the years 1990-2012 in increments of one year. On the horizontal axis, we see the months for each year.
Each little eclipse symbol is a data point on the graph. So an annular solar eclipse happened in January 1990, right before a total lunar in February. More recently, we had partial solar eclipses several times around the globe during 2011, and a couple of total lunar eclipses.
You’ll notice that all of these eclipses fall into distinct “bands” across the graph. Each of these bands represents the eclipse seasons for each year. Eclipse seasons are a time when both the moon and the sun are positioned well for an eclipse.
Just so you know, since I had a hard time making it out myself…the symbol for the “mixed” eclipse in the key looks like an annular eclipse with a thinner ring of the sun around the moon’s disk. There’s only one on the graph, in April 2005.
And that concludes our discussion of eclipses! It’s been six posts, and I’m ready to move on. I had planned to start diving into biology, but I think I’m gonna change things up on you…I’m too excited to start writing about archaeoastronomy.
Want to know what the heck archaeoastronomy even is? Check out my post tomorrow!


Did I blow your mind? 😉