

Meet NGC 1566, an intermediate spiral galaxy in the constellation Fornax.
To the human eye, this galaxy looks almost like any other spiral: It has a central nucleus and spiral arms, and it’s full of gas and dust. As an “intermediate” spiral, its nucleus has a bit of a barred structure, but not a strong one. All that’s pretty normal, as galaxies go.
But if we look a little closer, we see that this galaxy’s nucleus is unusually bright, especially for its small size.
As it turns out, NGC 1566 isn’t so normal after all…
This galaxy is what we call a Seyfert galaxy, named for astronomer Carl Seyfert of Mount Wilson Observatory. More generally, it is an active galaxy.
But…what the heck do I mean by “active”?
Most galaxies, like our own Milky Way, are not active. They lead very gentle, quiet lives. But there’s a very small percentage that emit floods of energy from their nuclei, dubbed active galactic nuclei (AGN). These are the galaxies I’m talking about.
There are several types of active galaxies. Seyfert galaxies, in particular, are identified by their small, highly luminous nuclei — like NGC 1566 above.
But there’s something else that sets Seyfert galaxies apart…
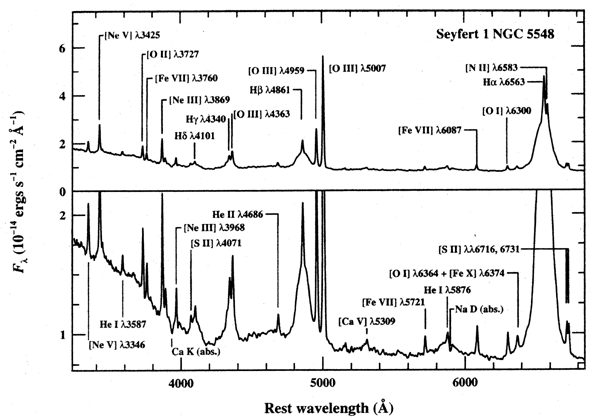
This is the spectrum from active galaxy NGC 5548, a lenticular galaxy (a type of disk galaxy that, unlike a spiral, is free of dust and gas). Specifically, it’s a spectrum of the galaxy’s nucleus.
But first, let’s backtrack a little and review what a spectrum is.

Everything we know about everything in the universe, we know from studying “light” — scientifically known as the electromagnetic spectrum (or EM spectrum for short).
(Well, until recently, that is. The advent of gravitational wave detectors gives us a whole new toolbox! But we’ll cover that another time…)
Anyway.
In general, every object that astronomers study either emits or reflects light. That’s not necessarily visible light, though. Visible light is just a narrow range of wavelengths that humans evolved to see. Astronomers make use of the entire EM spectrum, from gamma rays to radio waves.
We use different types of telescopes to collect the different types of EM radiation. But, on its own, that radiation isn’t very useful to us.
It’s a lot more useful to use an instrument called a spectrograph to separate light into its individual wavelengths. And we get something like this:

These are spectra: graphs that plot the wavelength of light against its intensity. Spectra show us where particular wavelengths are being emitted or reflected more strongly than others. And they show us where certain wavelengths aren’t coming through at all.
This happens when materials in an object — the elements of the periodic table — either absorb or emit specific wavelengths.
If elements absorb certain wavelengths, they “block” those wavelengths from ever reaching astronomers’ telescopes on Earth. Sharp dips appear in the intensity of the wavelengths. Because the elements are absorbing the light, this is called an absorption spectrum.
And if elements emit light at certain wavelengths, sharp spikes in those wavelengths appear. Because the elements are emitting this light, we call this an emission spectrum.
The pattern of emission and absorption “spikes,” known as spectral lines, are like fingerprints that can tell us exactly which elements are involved.
If you take the spectrum of a star, you’ll see something like this:
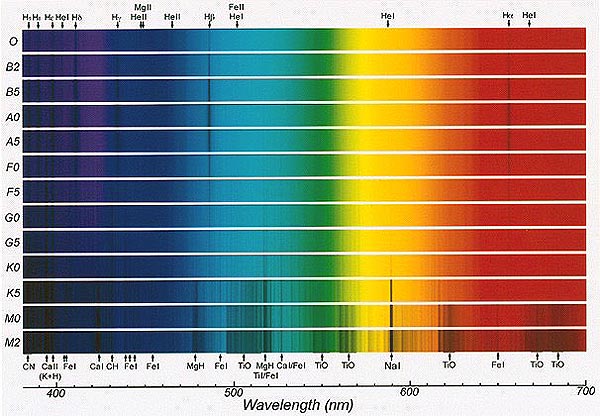
This graph shows the absorption spectrum for all the main types of stars. (The letters on the left are spectral classes.) The dark lines show where certain wavelengths of light have been blocked by elements in the stars’ atmospheres, and many are labeled (such as TiO in the coolest stars at the bottom).
Now, what does all that have to do with galaxies?
Here’s a typical galactic spectrum:
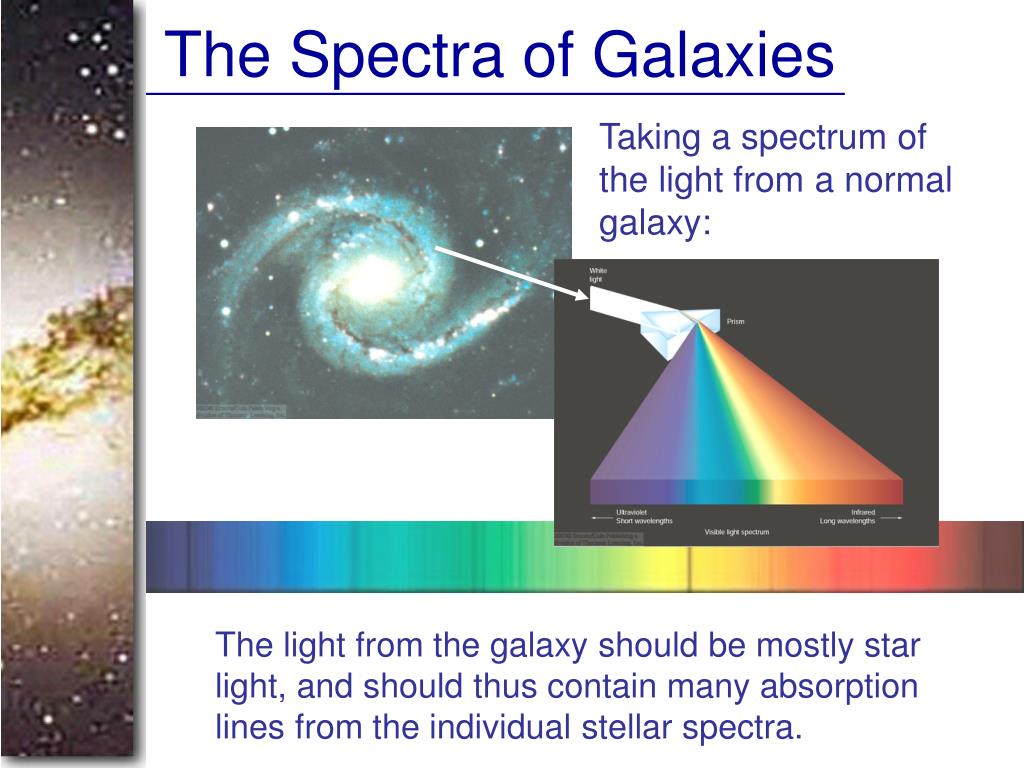
Galaxies are made up of billions of stars, so galactic spectra are the blended spectra from all their stars. Weak spectral lines get washed out because those blocked wavelengths are being emitted and reaching our instruments from somewhere in the galaxy.
The spectrum I showed you above — of NGC 5548 — is not a typical galactic spectrum.
Here it is again:
Alright, let’s break this down a bit.
First, let me clarify something that confused me at first. The bottom graph is a zoomed-in view of the top graph. Notice that the range on the vertical axis of the bottom graph stops after 2, whereas the top graph shows the entire range of the data: up to 7.
Now, let’s take a look at those spikes. These are emission lines, and they’re labeled with the element (or ion) that produces them, such as “Ne V.” “Ne” is the atomic symbol for neon, and I presume “V” is the Roman numeral for 5, indicating that this is 5-times-ionized neon. (If that’s confusing, check out my post on atoms and radiation.)
Okay, so we’ve got that down. But…anyone notice something weird about these emission lines?
They’re broadened.
For reference, here it is side-by-side with a spectrum from a “normal” spiral galaxy:

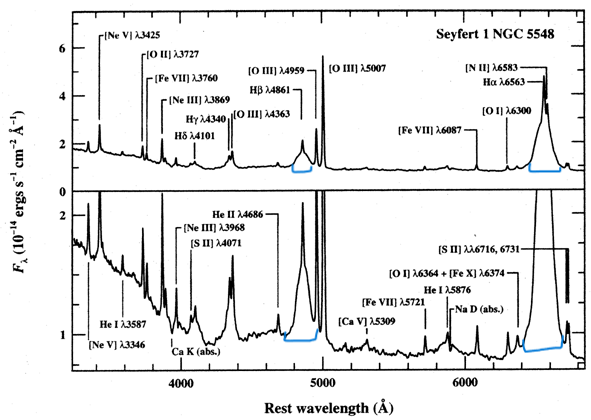
See where I’ve marked those broad spectral lines? They don’t look like normal spikes — more like skyscraper buildings!
Astronomers interpret these weirdly broad emission lines as Doppler shifts.
Remember that the Doppler effect is how we can tell that something in space is moving towards us or away from us. The spectral lines get blueshifted if the object is moving towards us and redshifted if it’s moving away from us.

If we can resolve enough detail to see individual objects approaching and receding from our vantage point, redshifts and blueshifts appear separately in spectra:
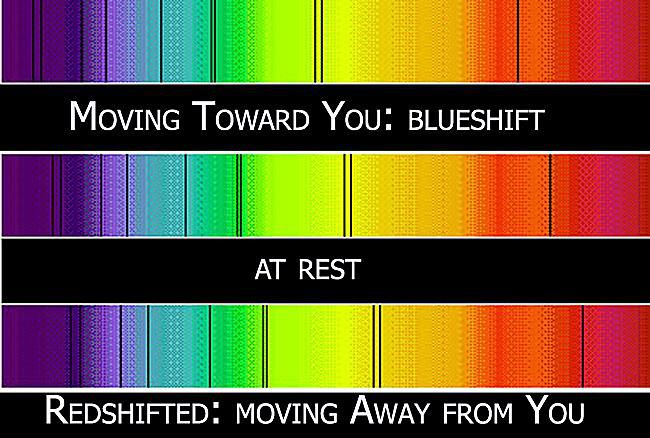
But if we can’t resolve that detail, we’ll see redshifts and blueshifts simultaneously. The “at rest” spectra will be stretched out to include the positions of the spectral lines both when redshifted and blueshifted.
That’s how we get broadened emission lines. (The example below is of a star’s atmosphere, but the concept is the same.)

Okay, so we’re dealing with Doppler-shifted emission lines. But what’s producing them?
Stars emit radiation across the entire EM spectrum, producing a continuous spectrum that becomes an absorption spectrum by the time it reaches our telescopes. Elements in the star’s atmosphere absorb some of it along the way.
But out in interstellar space, gas and dust clouds emit only a few specific wavelengths. They never produce a continuous spectrum in the first place. That’s how we get emission lines.
There’s another catch, though. In order for interstellar gas to produce radiation strongly enough to reach instruments on Earth, it needs to be very hot. This energy causes the gas to expand and become low-density.
Anytime astronomers see emission lines, we know we must be looking at a hot, low-density gas. And thanks to the broadening going on, we know we must be dealing with some high orbital velocities: we’re seeing the redshift as the gas whizzes away from us around the galactic center, and the blueshift as the gas whizzes back toward us.

(This graphic is of the whole galaxy’s rotation, not just the nucleus — but, again, the concept is the same.)
Remember when I said that NGC 1566 had a weirdly bright nucleus?
That’s because, for some reason, we have some ridiculously hot, low-density gas whizzing around in there, producing broad emission lines.
But that’s not all I said about NGC 1566’s nucleus.
I also said it was weirdly small. It is, in fact, way smaller than a galactic nucleus should be…
This is data from galaxy NGC 7469. This is not a spectrum. This is a light curve: a graph of the intensity of light from the object over time.
What we’re seeing here is a change in the nucleus’s brightness over time. But not only that — we’re seeing a quite dramatic change over an astronomically short period.
Changes in brightness of Seyfert galaxy nuclei are particularly apparent at X-ray wavelengths. Their brightness can change significantly in only a matter of minutes. And this suggests something incredible.
You might remember from our discussion of pulsars that an object cannot change brightness in a time shorter than the time it takes light to cross its diameter.

Imagine that a normal star blinks on and then off in the space of 0.001 seconds. You won’t see a 0.001-second pulse. Why?
Remember that the objects we’re talking about are spherical. They have a single point on their surface that’s closest to an observer on Earth, and the rest is a bit farther away. It has a slightly longer distance to travel.
Even as the light from the point on the object closest to you changes brightness, the same fluctuation occurs for the light coming from the rest of the object. For most objects in the universe, by the time the light from the top or bottom “limb” of the object reaches you, it has most definitely been longer than 0.001 seconds.
The result? You’ll essentially see the change in brightness smeared over a greater time interval than it actually took the object’s surface to fluctuate.
So, if an object can change brightness significantly in only a few minutes — like a Seyfert galaxy nucleus — it can’t be larger than a few light-minutes in diameter.
People…a few light-minutes is about the diameter of the Earth’s orbit.

We’re talking about whole galactic nuclei here. That’s an insanely small region. And yet, it’s emitting floods of energy. Just the nucleus of a Seyfert galaxy can emit a hundred times more energy than our entire galaxy.
And we’ve got hot gas whizzing at crazy speeds around the centers of those nuclei, producing broad emission lines.
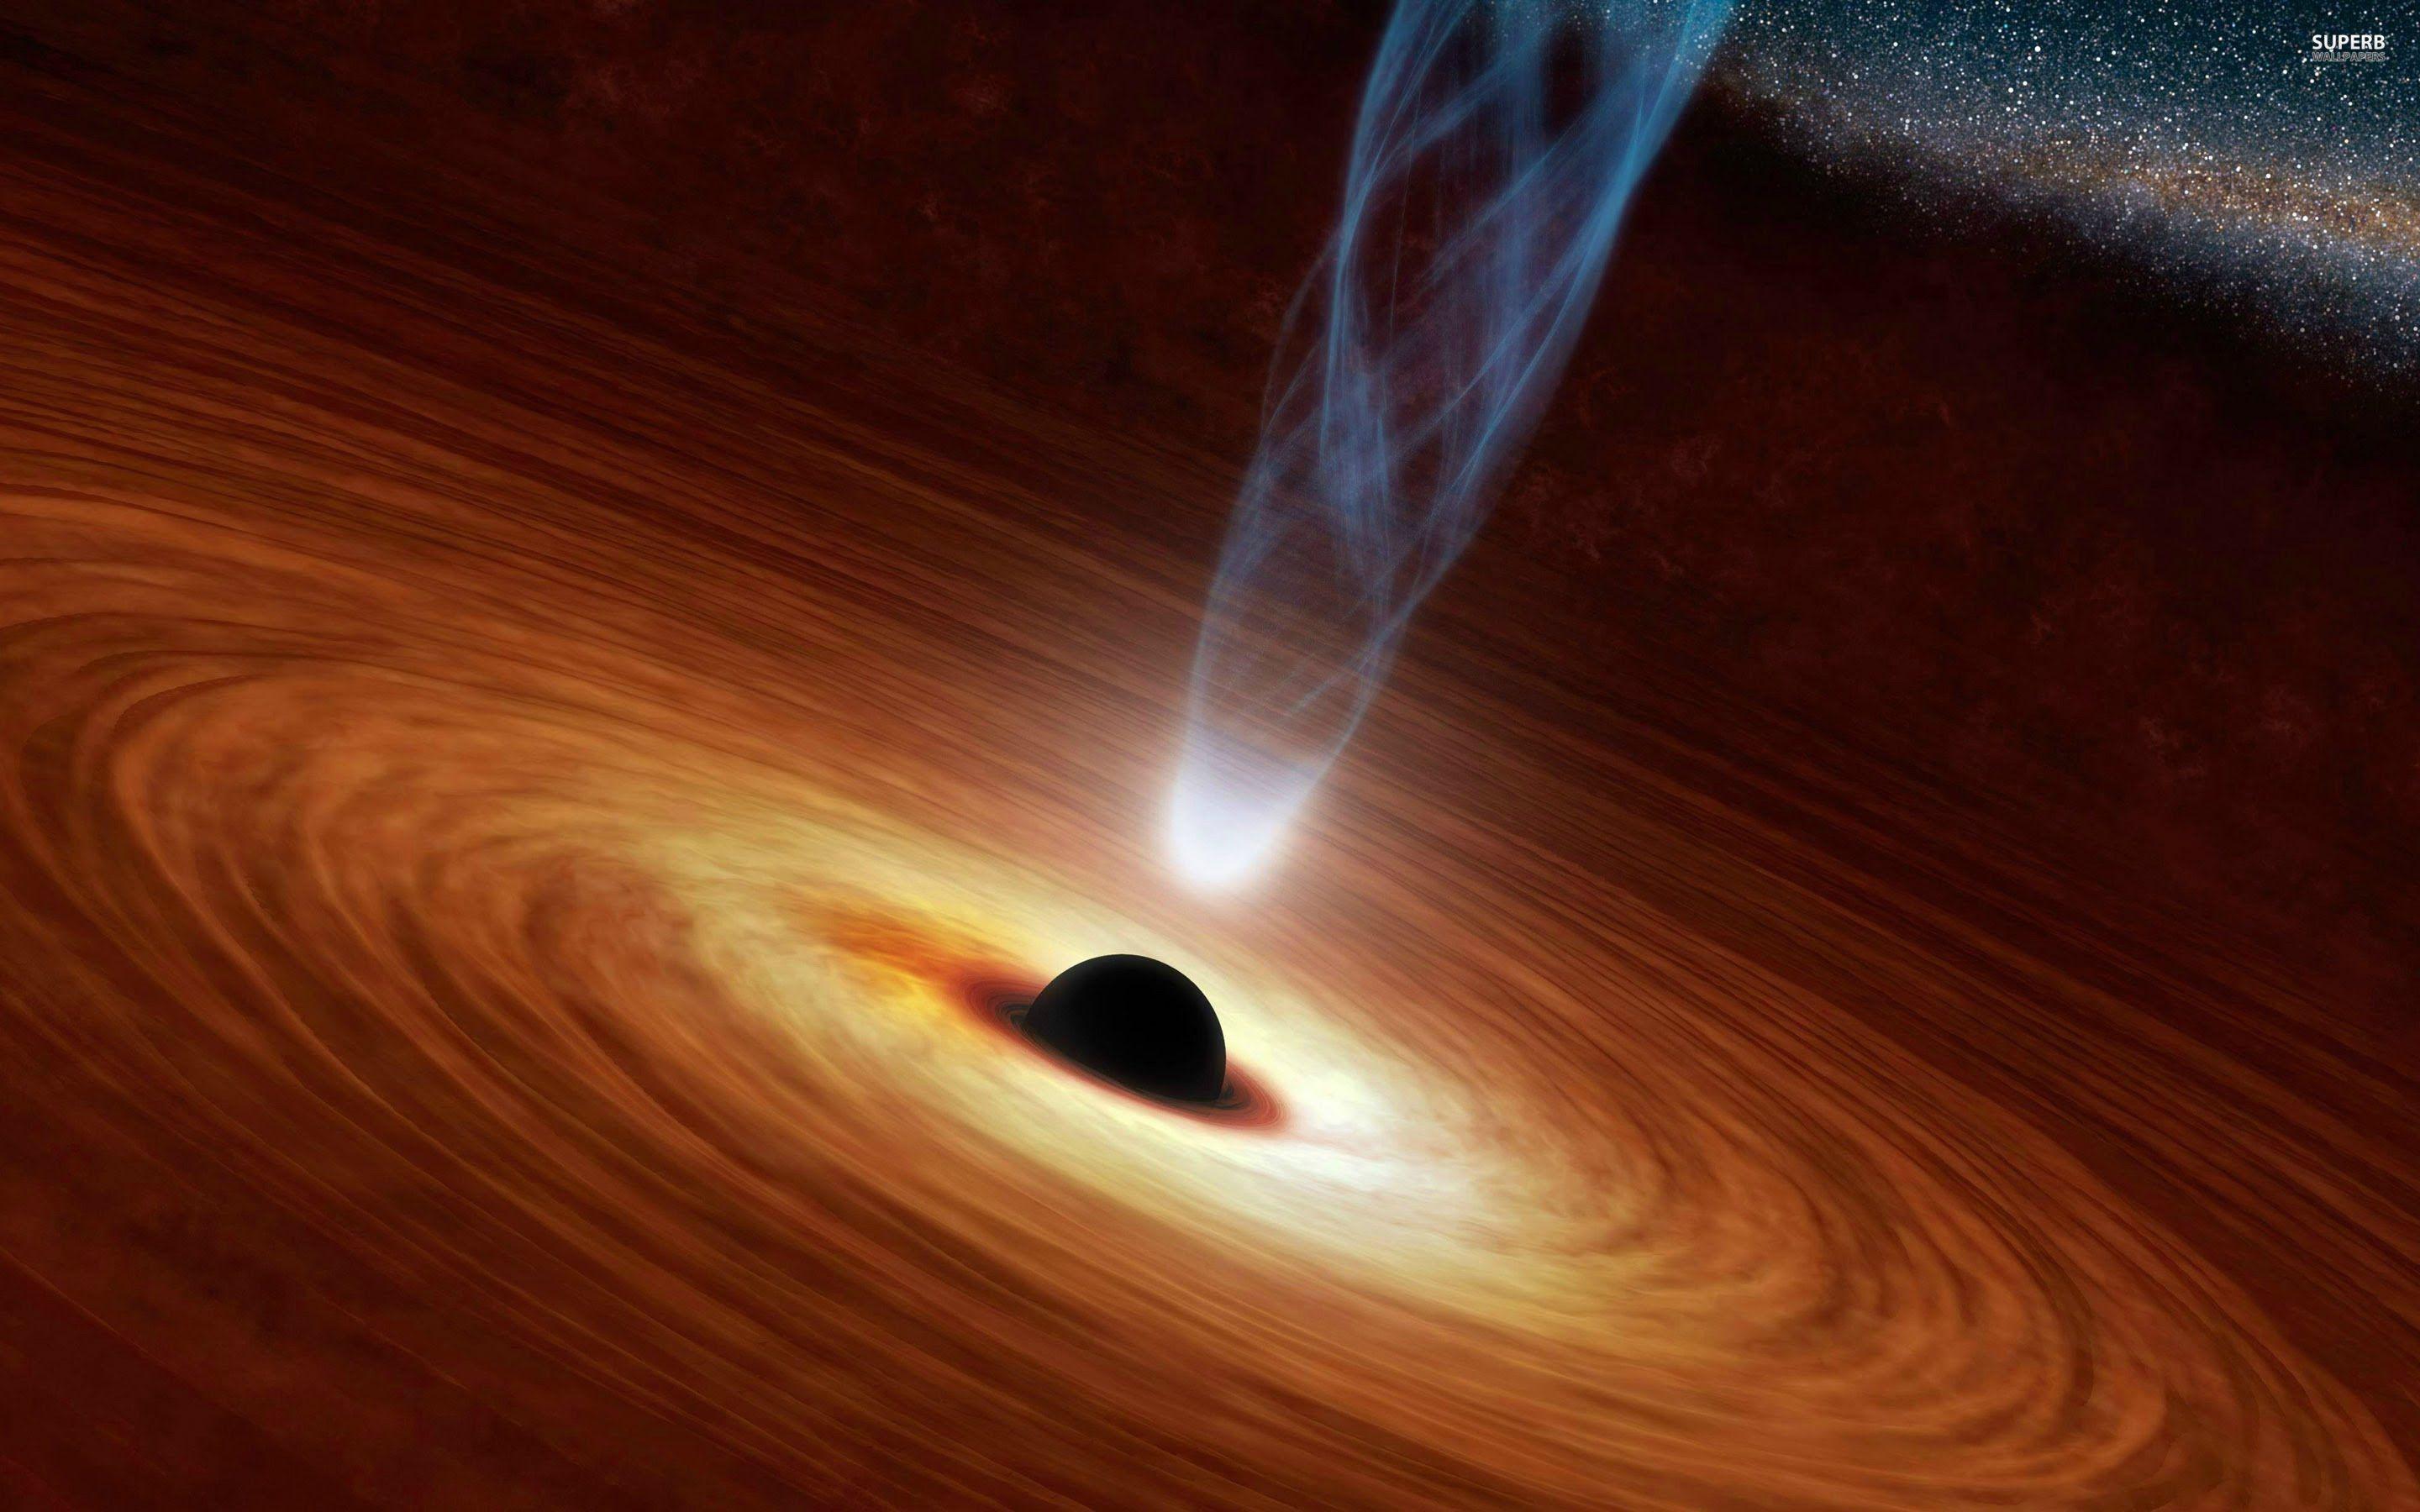
Something in the nuclei of Seyfert galaxies is producing incredible amounts of energy and accelerating orbits to insanely high speeds…but can’t be bigger than the orbit of our own home planet.
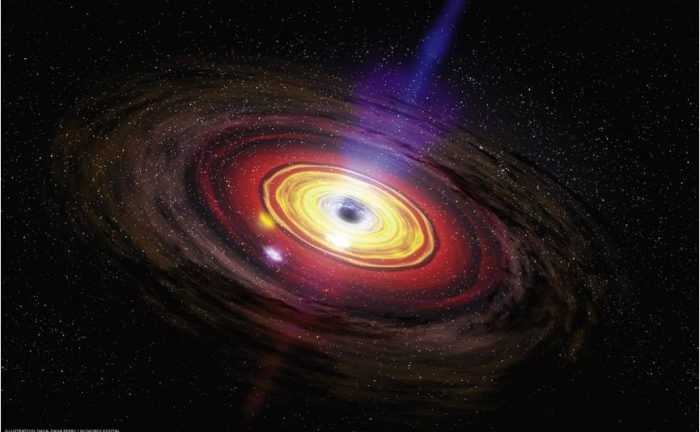
Astronomers recognize this evidence as the telltale signs of a supermassive black hole.
But here’s the problem.
We already know that most galaxies have supermassive black holes in their nuclei, but like I said before, most galaxies are not active like Seyfert galaxies. So, why do these galactic nuclei seem to be going crazy?
The key lies in the shapes of Seyfert galaxies, and their interactions with nearby companions.

NGC 7469, the main spiral in this image, is a Seyfert galaxy. You can tell by that small, bright nucleus. But take a look at its companion.
See how distorted that galaxy is?
Many Seyfert galaxies are found in interacting pairs of galaxies, and many show evidence of tidal interactions. That suggests that, somehow, galactic collisions and interactions trigger the activity in the nuclei of Seyfert galaxies.
In order to understand just what is going on in these nuclei, let’s take a look at some other types of active galaxies…coming up!


Did I blow your mind? 😉