
What the heck is the average star like?
We’ve talked about a lot of stars over the past few weeks. We’ve discovered the vast distances between the stars, looked more closely at what really makes a star bright, and covered all kinds of ways to classify stars — from their spectral type to their luminosity class.
Most importantly, we’ve looked at the H-R diagram, the diagram that classifies stars by their color, temperature, composition, and luminosity…and relates those properties with many other features stars have.
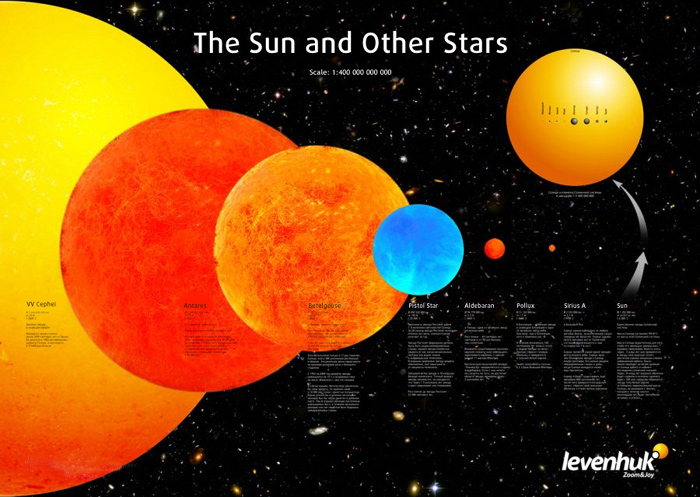
We know what kinds of stars are out there. We know they range from thousands of times smaller than the sun to thousands of times larger. We know they range from desperately faint to incredibly luminous. We know they come in all the colors of the rainbow.
But how many blue stars are there? How many small stars are there? Are most of them small, or are there about the same number of small stars as large ones?
First of all, let’s take a look at that H-R diagram I mentioned.
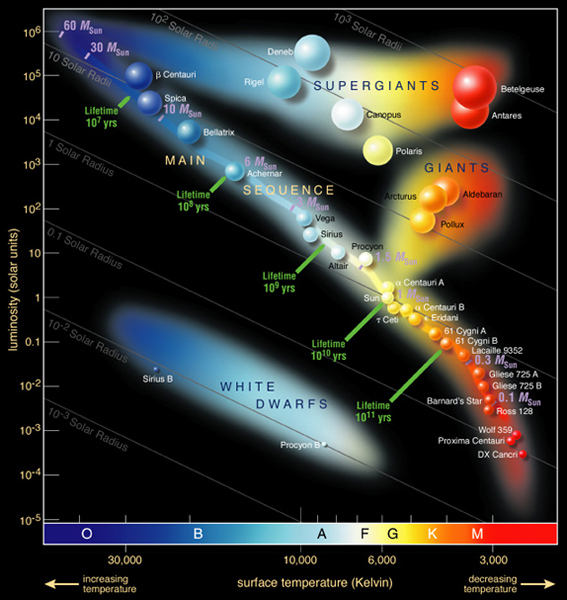
The H-R diagram tells you just about anything you want to know about any star. As long as you can plot it along the temperature axis and the luminosity axis, you can learn just about anything about it.
We can easily discover its temperature and luminosity just by studying its spectrum. Once we learn both of these, we can determine its distance.
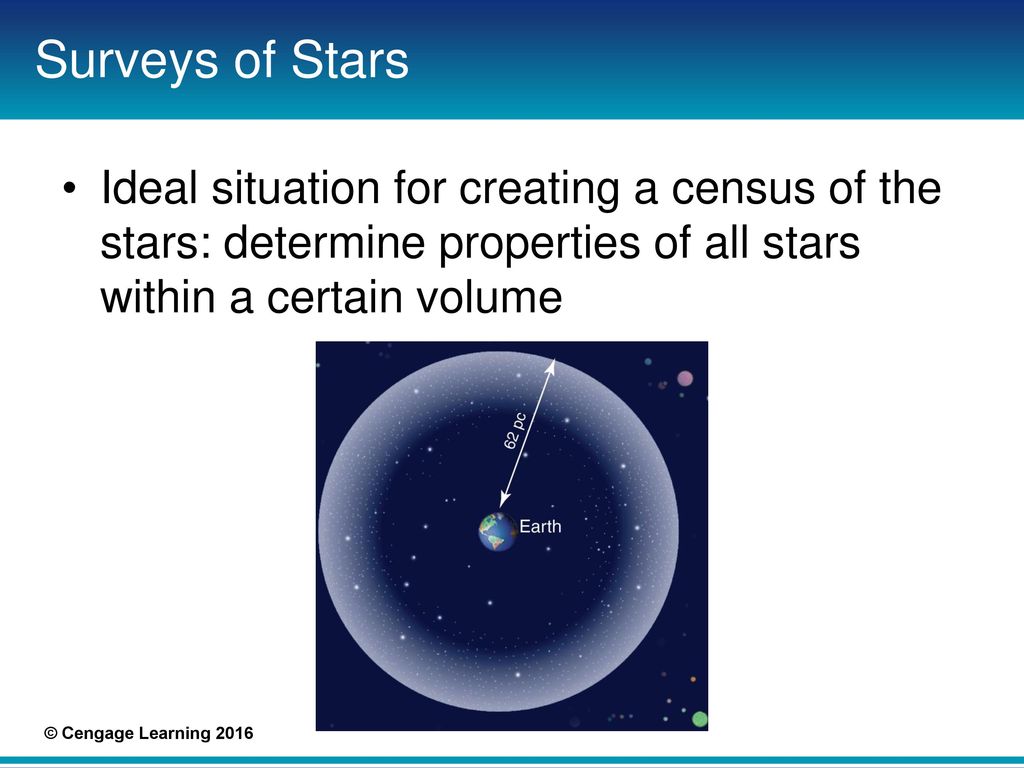
Now let’s take a survey of a specific region of space. Let’s start with an area around the Earth of a million cubic parsecs.
What exactly is a parsec, again?
A parsec is 3.26 light-years. And a light year is about a quarter of the distance to the nearest star. It’s the distance light travels in one year.
But doesn’t light travel instantaneously, you say? What do I mean, the “distance it travels in a year”?
Light doesn’t travel instantaneously, but it seems like it. It travels so fast, it could wrap itself around Earth’s equator seven and a half times in one second.
With that in mind…it takes 4.3 years to reach the nearest star, Proxima Centauri.
3.26 times a light-year is a parsec. Our survey region is a million cubic parsecs — a sphere around Earth with a radius of about 62 parsecs, like so.
Immediately, we run into a few problems.
First, how the heck do we know which stars are part of our survey? It’s one thing to survey a specific region of the sky…
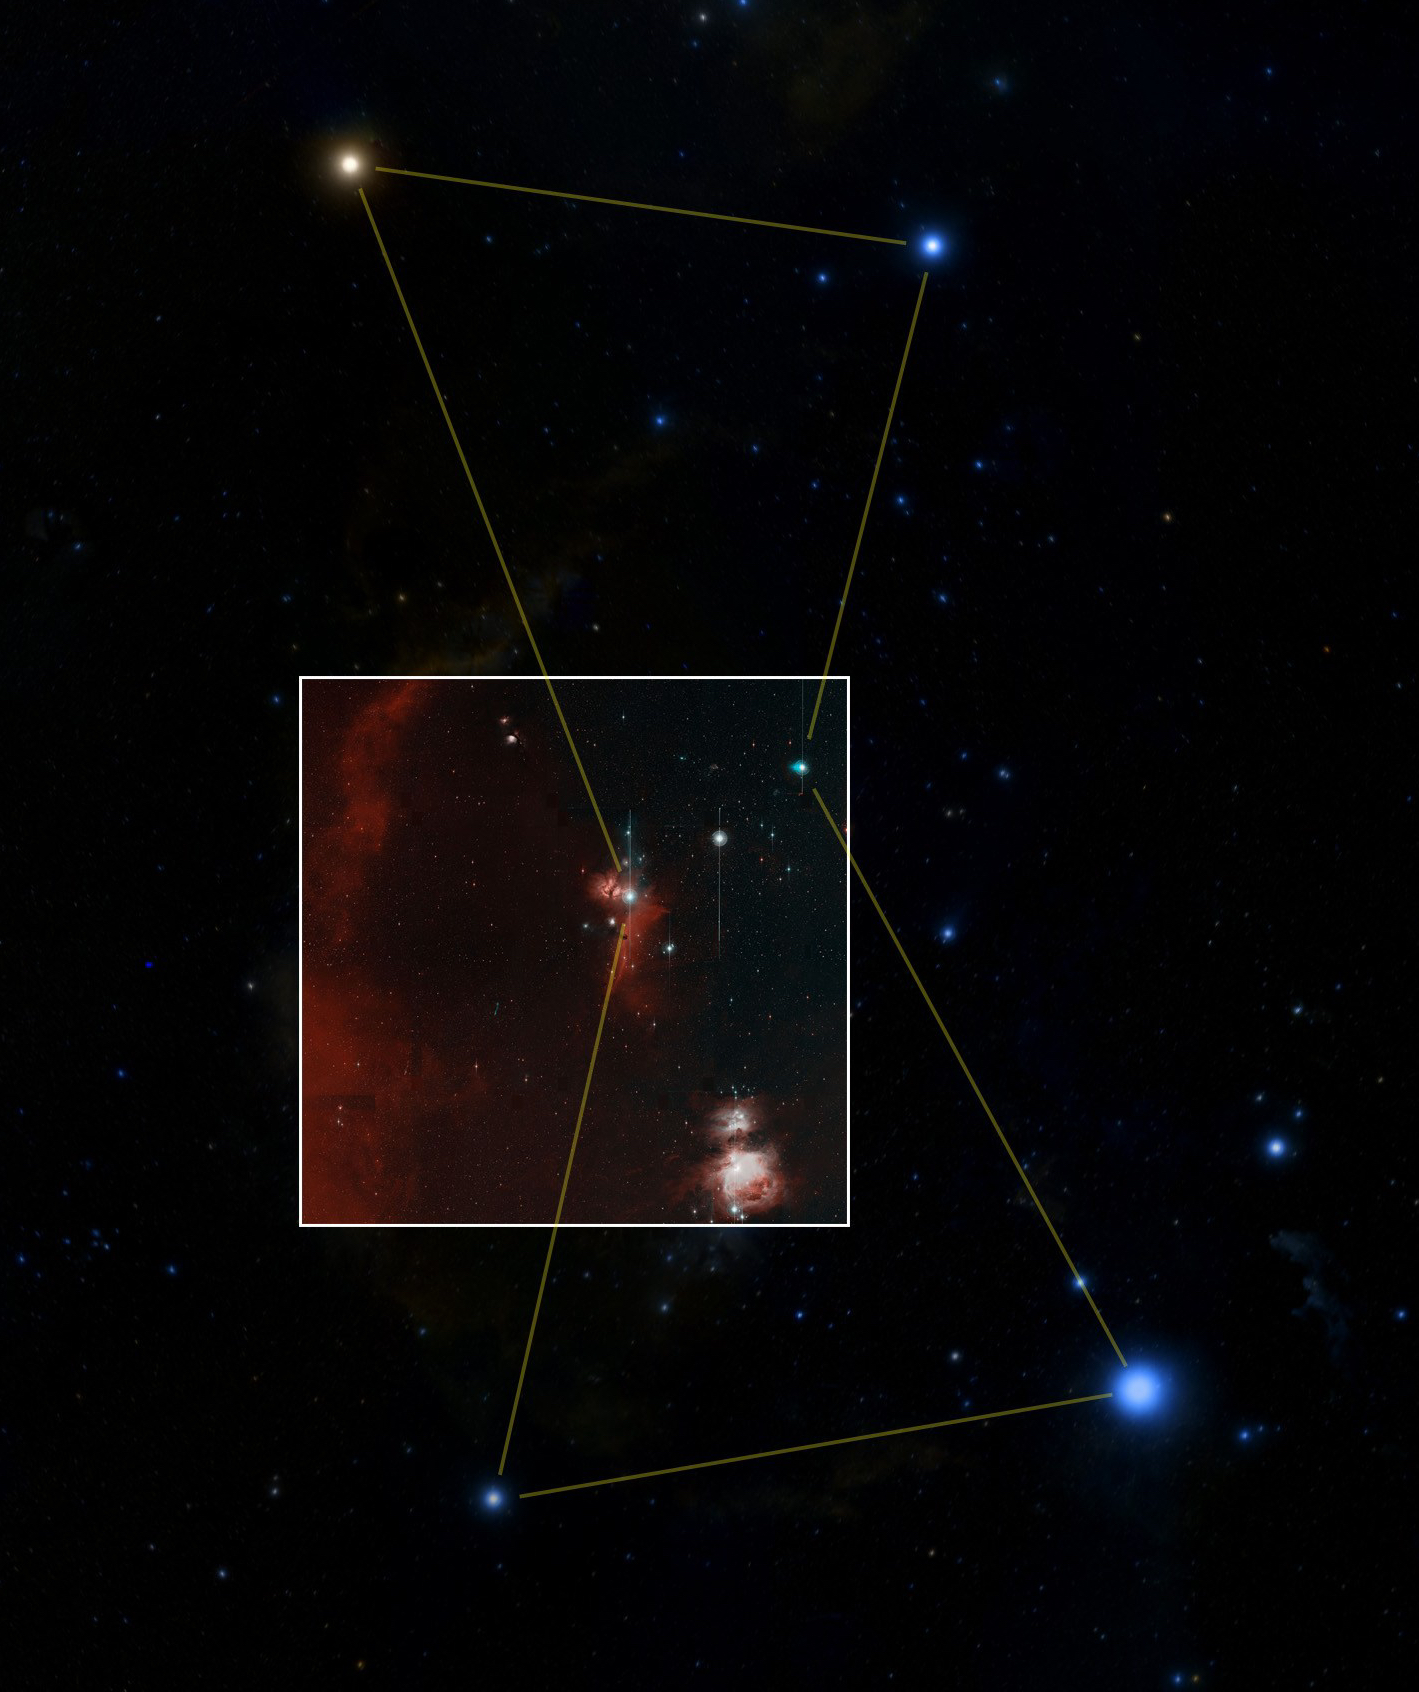
…and quite another entirely to survey only the stars that are within 62 parsecs of Earth.
Actually, it’s easy. All we have to do is take a survey of the entire sky. That’s right: every single star in the sky. Then we just have to eliminate all the stars that are too far away and delete them from the survey.
Sound hard?
Again, I have to say…not really. Not since the development of high-speed computers that can enable telescopes to make millions of observations per night. And we don’t even have to sort through the data ourselves.
Seriously. A computer can analyze each star’s spectrum, plot it on the H-R diagram, determine its distance, and then sort all of its millions of observations under either of two categories: part of the survey or not part of the survey.
Then we get to do the fun bit. We get to look at what we found.
And here’s what we find, in terms of the H-R diagram.

Here, the H-R diagram has been tipped on its side so that a bar graph can rise from it. You can see from the height of the bars how common each type of star is.
This diagram tells you that within the million cubic parsecs surrounding Earth, lower-main-sequence stars and white dwarfs are the most common. These are all fainter stars. White dwarfs are extremely hot, but their tiny surface area means they’re not very bright at all.
On the other hand, upper-main-sequence stars, giants, and supergiants are extremely rare. The hottest stars are the O-type stars, which are typically also very large and luminous — but there are none within 62 pc of Earth.
Clearly, our chosen region of space isn’t a representative region. There are O-type stars out there, just not that close to us. But the results of our survey are helpful. We know that O-type stars must be extremely rare, rarer than the giants and supergiants.
So what’s up with the bright stars we see in the night sky?
I’ve mentioned before that stars might be bright because they’re near us, or because they’re particularly luminous. It’s possible for a star to be bright because it’s both close and luminous, but that’s not the case for the stars in Earth’s night sky.
The brightest star in the sky, Sirius A, is a main-sequence star, spectral type A1V. Look at the H-R diagram bar graph up above — you’d find it along the main-sequence line in the bluish purple section. Its size and luminosity is actually fairly average for a star. But it’s very close to us, only 2.6 pc away. That makes it appear very bright.
Take Sirius B, though, a white dwarf in orbit of Sirius A. It’s very dense and hot, but it’s also very small, making it very dim. Since it’s in orbit of Sirius A, it can’t be much farther away from us than 2.6 pc. But we can barely see it with a telescope.
Other stars are very distant, but bright in the night sky because they’re incredibly luminous. Betelgeuse, for instance, is 197 parsecs away, but appears bright to us because it’s a bright supergiant with one thousand times the sun’s radius.
Next up, let’s take a closer look at why stars shine bright.


Did I blow your mind? 😉