What makes a star shine bright?
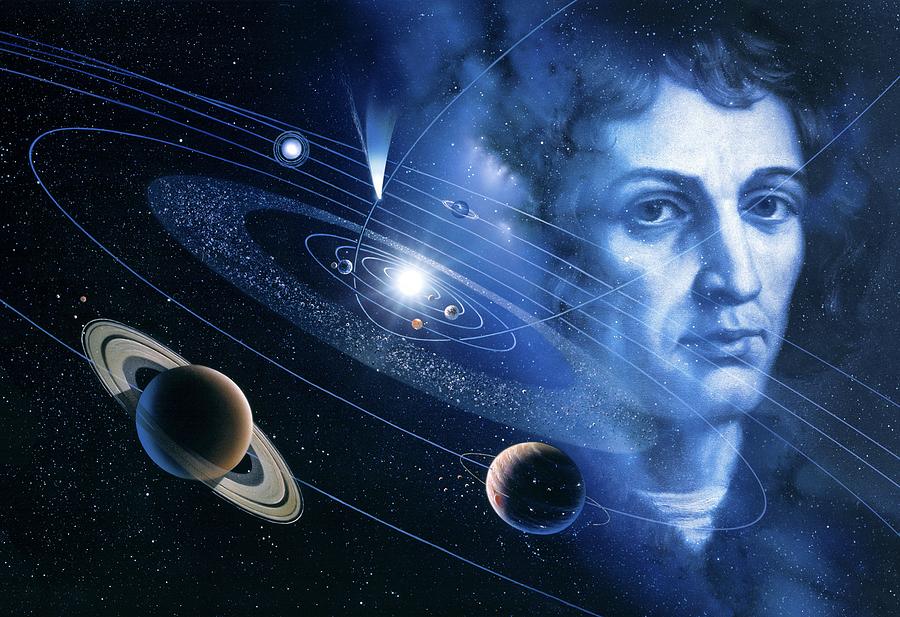
Much earlier on — probably months ago now — I explained how something called the proton-proton chain generates massive amounts of energy within stars, and enables them to fuel whole solar systems. That’s the battery of a star.
We’ll address the proton-proton chain later, when we start talking about star life cycles. We’ve still got some talk about nebulas and interstellar space to go before we get that far. For now, what’s important is that the proton-proton chain depends on high density.
That is, stars will have the strongest batteries if they have very dense interiors. It doesn’t really matter how dense their middles and atmospheres are. But conditions in their cores must be very dense.
You’ll find, if you study stars closely, that there is a definite relation between their densities, masses, and luminosities.
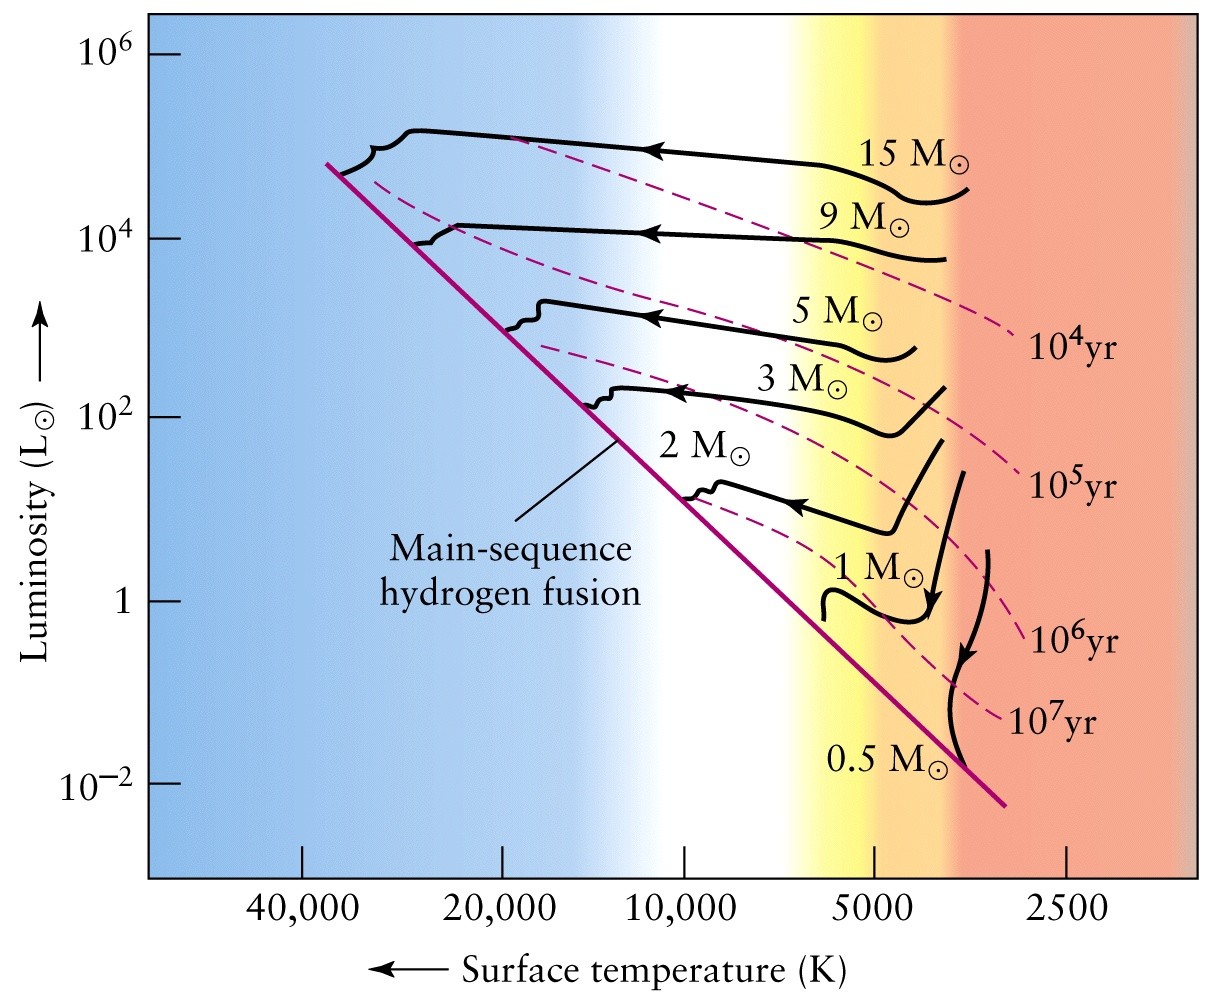
Let’s start with the H-R diagram, the single most important chart diagraming stars.
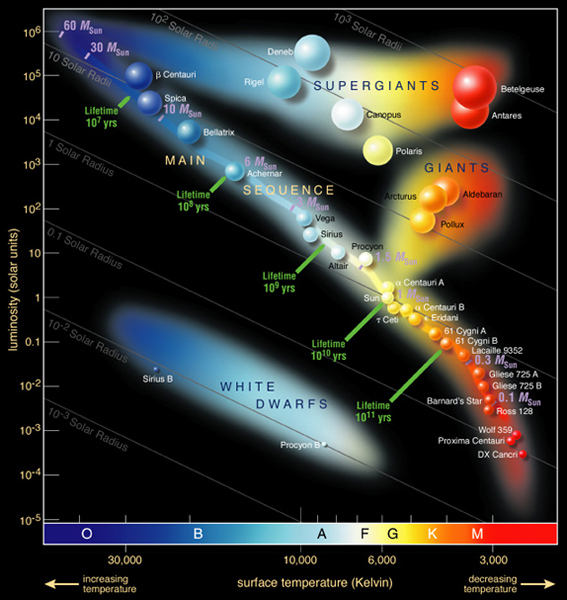
The H-R diagram organizes stars according to just about everything you could possibly want to know about them. You can see their temperature (and spectral class — O, B, A, F, G, K, or M) on the horizontal axis. Their luminosities — the total energy they emit — are on the vertical axis.
Organizing stars according to temperature and luminosity allows you to see the distinct patterns here. Some stars, the white dwarfs, are extremely hot but also extremely faint. That tells us that they must be very small.
The main sequence stars range from not too much larger than a white dwarf to almost as large as a giant, increasing in luminosity all the while. And giants and supergiants are the largest and most luminous of stars, but also relatively cool.
By studying binary stars, we can get a good idea of the masses of most stars. And yes, that’s different from size. Size can be measured in feet, meters, kilometers, etc. Mass is how much stuff — how much matter, to use a more scientific term — is in an object.
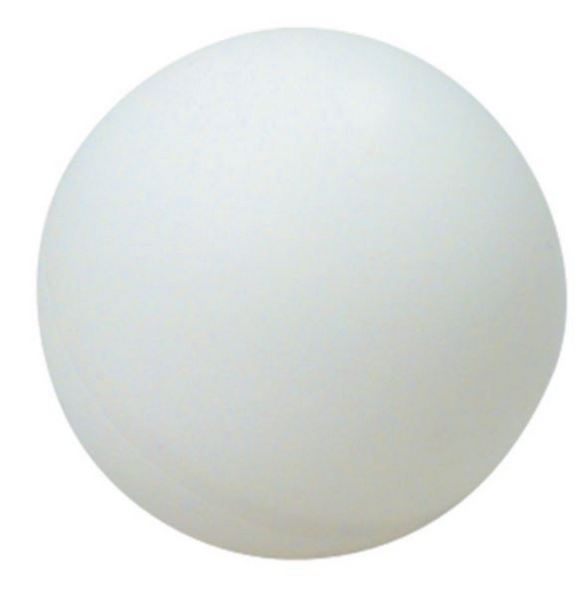
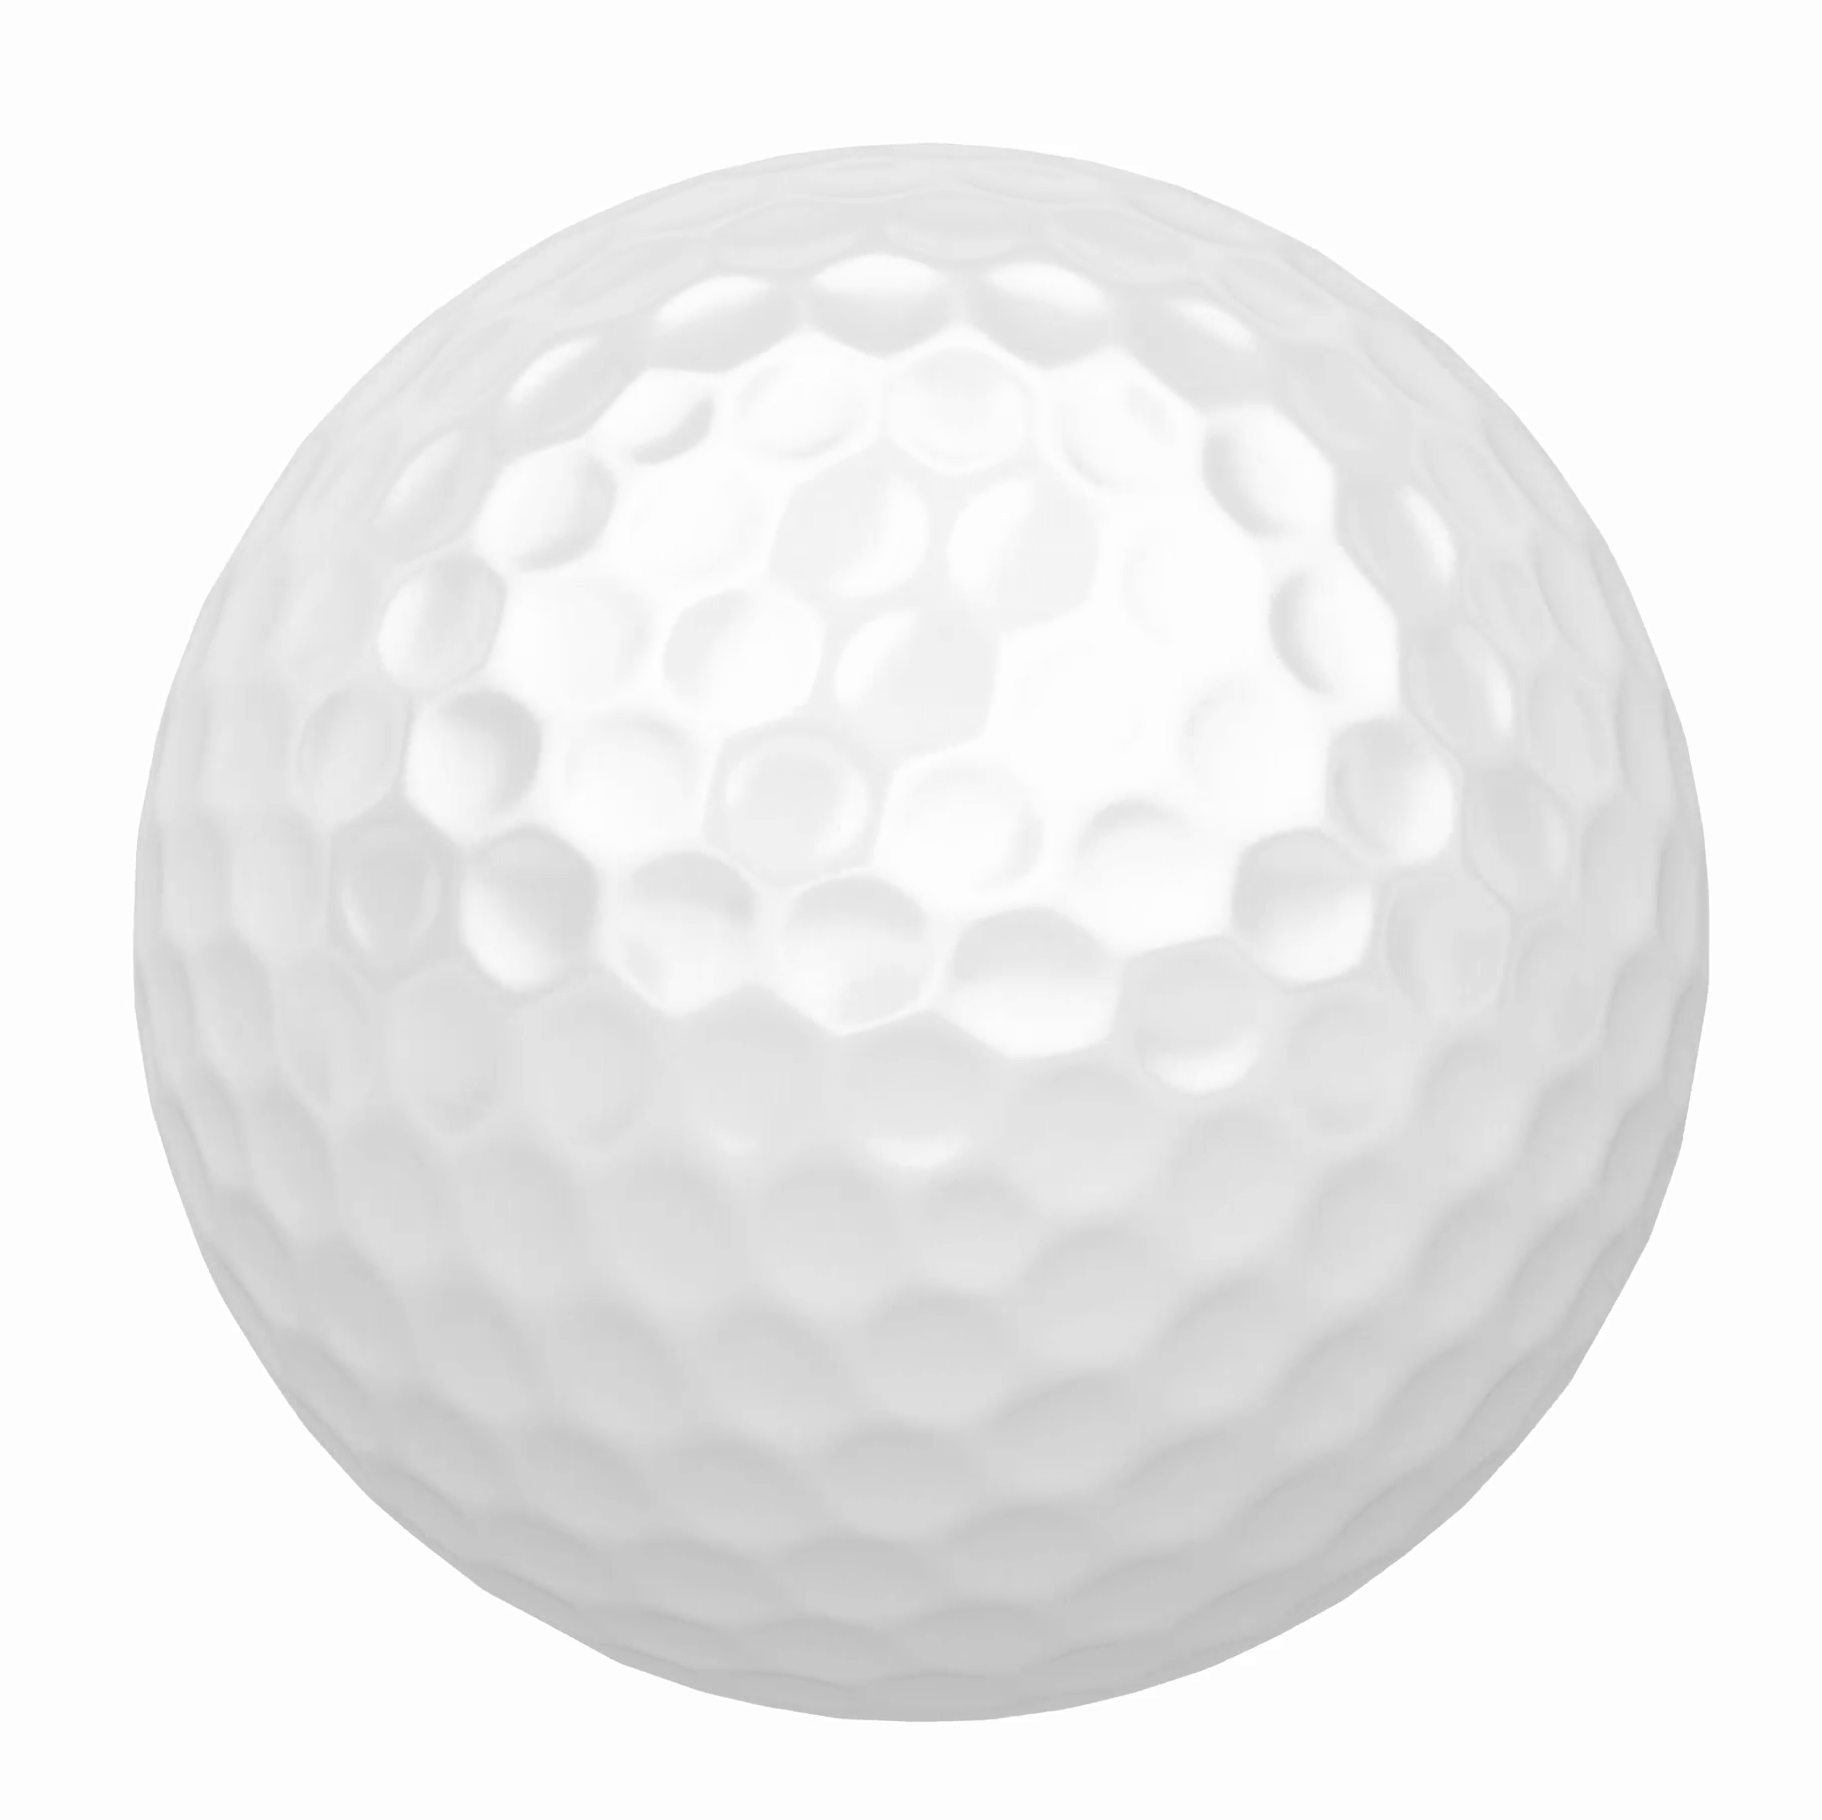
Essentially, size is like volume — how much space an object fills. But a ping-pong ball is much less massive than a golf ball. There’s less stuff inside it.
It’s impossible to directly measure a star’s mass. You can measure your own mass by standing on a scale — the kind you think you use to measure your weight. You’re actually measuring your mass.
But we can’t set a star from outer space on a scale. In fact, there’s not a scale on Earth that could hold a star, or even a small planet, for that matter. So we have to resort to more indirect methods. We have to look for the effect of the object’s mass.
Wait a sec…what does that even mean?
Mass has an effect on the space around it…called gravity. The more massive an object is, the stronger its gravity is, and the better able it is to hold onto a planetary system.
Now, planets seem to be the norm rather than the exception in our galaxy, so if it were this simple, it would be easy. We could just watch all those little planets circling around any one star up in the sky and measure the star’s gravitational force…and thus, its mass.
But it’s not that easy. Planets are super hard to detect. It’s hard enough to observe Neptune, the farthest known planet of our solar system. Imagine trying to observe planets that size (and that dim) around stars light-years away from us?
That’s why we resort to measuring stellar masses through binary stars. I’ve spent the past several posts talking about them.
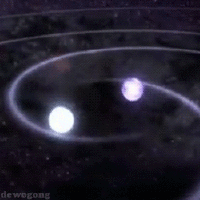
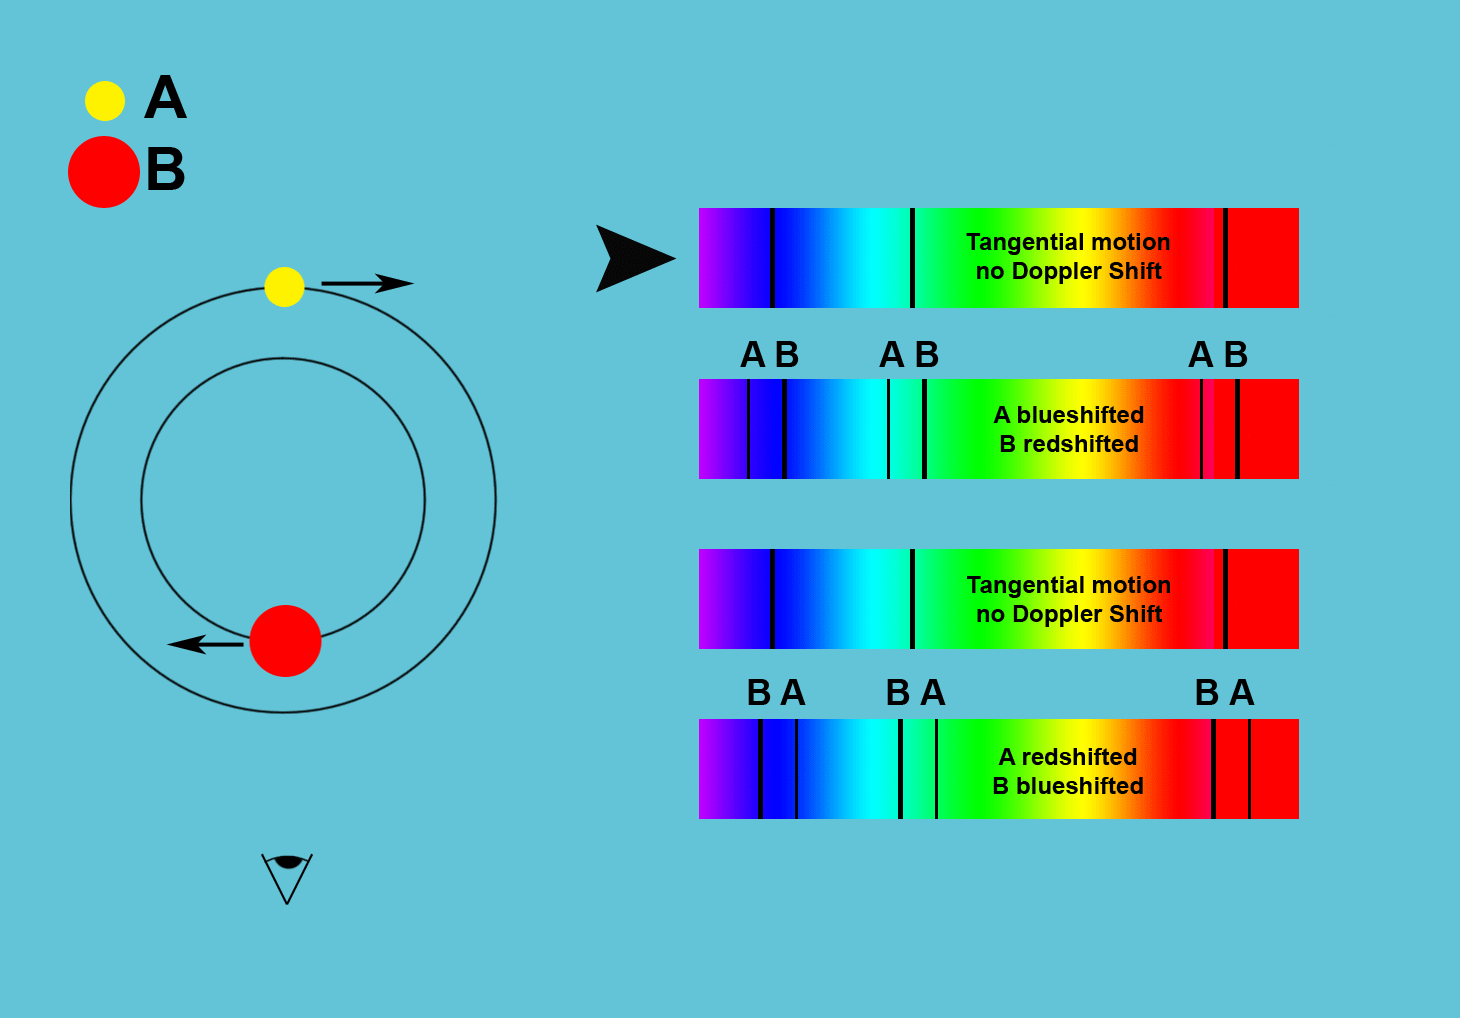
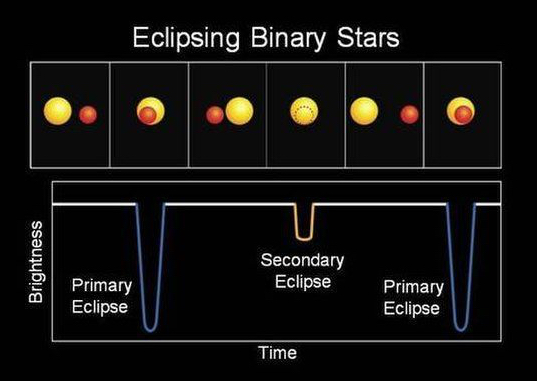
They’re star systems unlike our own where two or more stars orbit one another. And because all the stars in these systems give off their own light, it’s much easier to observe them and use their gravity to measure their masses.
Once we know a star’s mass, we can make note of it on the H-R diagram…and we can look for patterns.
The masses of stars are measured in solar masses — abbreviated as M⊙. One M⊙ is exactly the mass of the sun. 2 M⊙ is twice the mass of the sun…and so on.
As we plot stellar masses on the H-R diagram, we begin to notice a pattern right away — at least, that is, in the main-sequence stars. The greater the mass, the more luminous the star.
Seriously. Here’s our more illustrated H-R diagram, replicated below. If you start at the top of the main-sequence — near the top left corner of the graph — you’re looking at more massive, luminous stars.
But follow the main-sequence line down to the bottom of the graph, and stars get not only progressively less massive, but progressively less luminous.
We call this the mass-luminosity relation.
Of course, like all relationships in science, there’s an equation for it: L= M3.5. But we’re not going to bother with that. The math isn’t complicated or scary, but I see no reason to spend time on it.
(In case you’re curious, though, L represents luminosity and M represents the star’s mass in solar masses.)
You will find, if you calculate the mass of any group of stars, that it doesn’t take a huge change in mass to make a huge change in luminosity.
We’ve observed stars between 0.08 M⊙ and 100 M⊙, which you might say is a huge difference in mass. But check out the observed range of stellar luminosities: between 10-6 and 106 solar luminosities.
That’s a huge difference for a relatively small range of masses.
It actually explains the equation above. Notice you have to raise a star’s mass to the power of 3.5 to get its luminosity? You’re not just multiplying it by a number — you’re taking an already astronomical mass and multiplying it by itself three and a half times.
Anyhow…I’ll bet you’re wondering how the heck this connects to density, which I told you powers a star’s battery.
Well. Mass, density, and volume are related. We already know stars’ sizes — volumes, essentially — from their location on the H-R diagram, and we just came up with an equation to figure out their mass. Density is just mass divided by volume.
A small star with a high mass will have a high density, because all its mass is getting squeezed into a small space…hence, it’s very dense. A larger star of the same mass will have a lower density due to its stuff not getting squeezed so much.
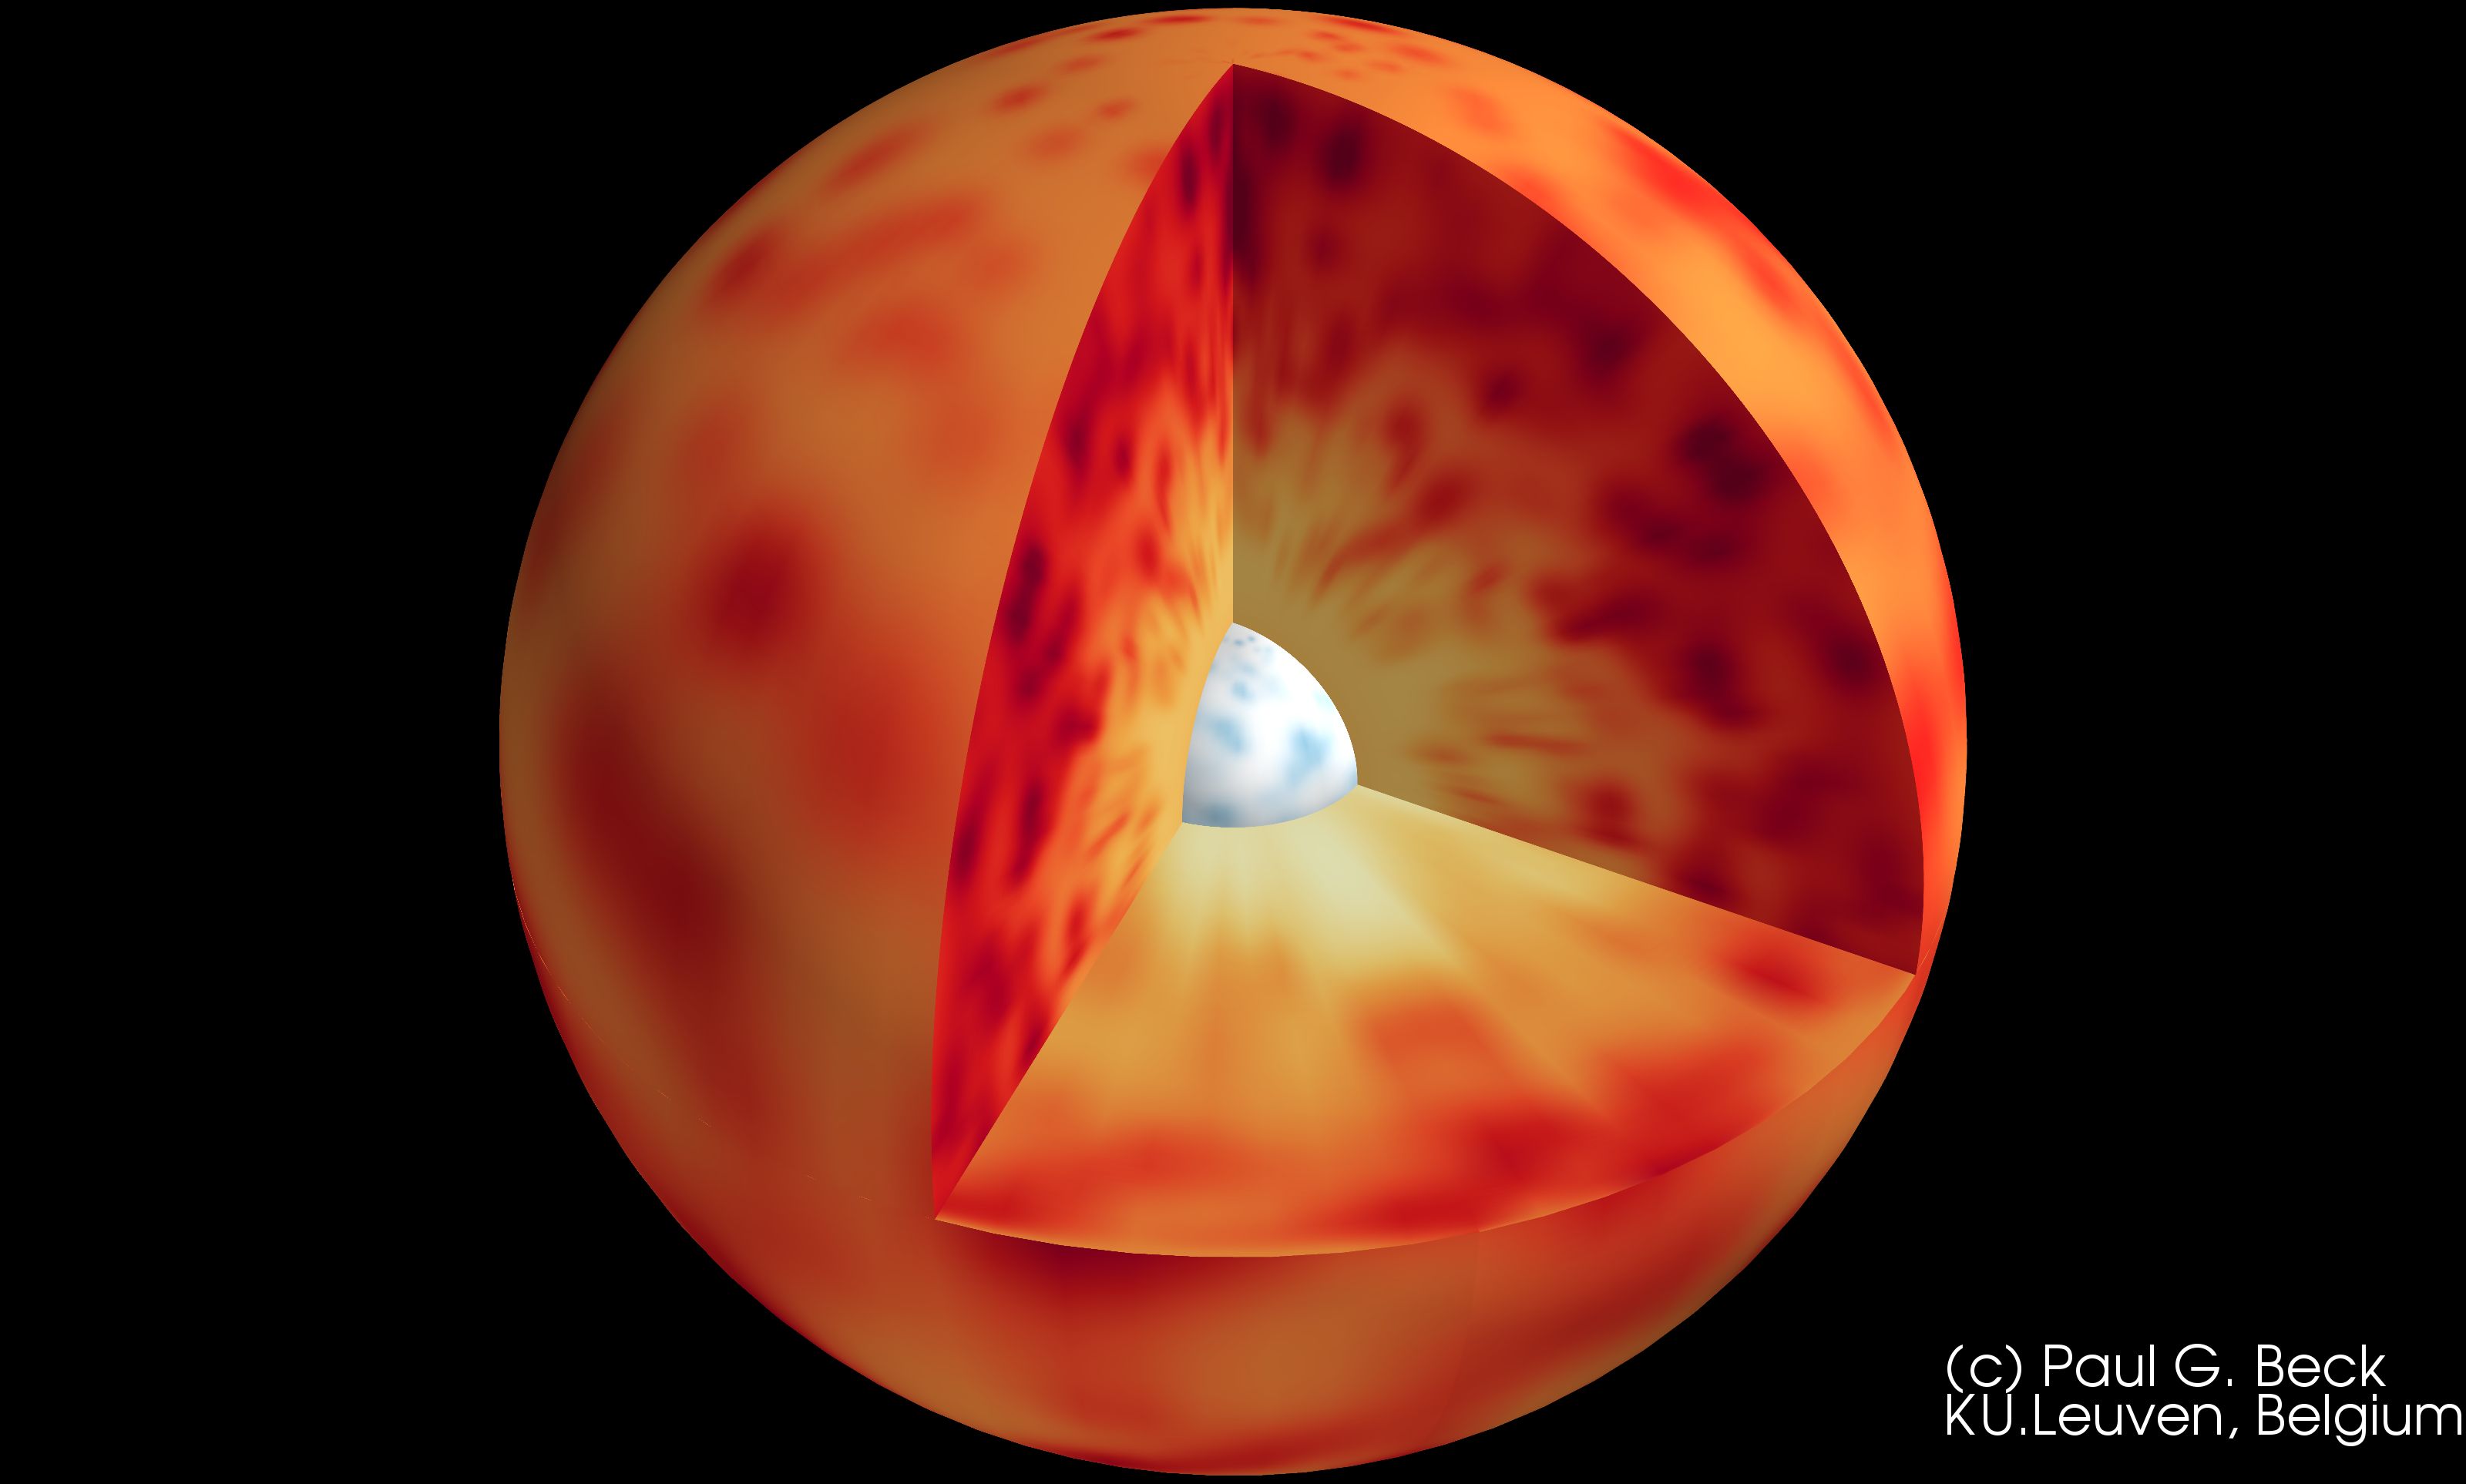
You’ll also find that stars are not uniform in density. Meaning, the deeper in you go, the density won’t be the same — it’ll actually increase. Stars are denser at their cores than in their atmospheres.
But what’s interesting is the pattern of different densities that we can find in the H-R diagram. You might say that a pattern is expected; after all, there was one for mass and luminosity. But here’s the thing. Mass and luminosity only seem to be directly related for the main-sequence stars.
Density shows a pattern for all the stars.
It’s true. Main-sequence stars seem to have densities similar to the sun. Stars that are much larger — the giants and supergiants — tend to be less dense than main-sequence. And white dwarfs, the smallest stars, are the most massive of all.
The more or less constant density of all main-sequence stars makes sense. Think about it…smaller stars are the least massive. Medium-sized ones are a bit more massive, but also a bit larger, so that mass has more space to fill.
And the larger ones are much more massive, but also quite a bit larger…meaning there’s still more space to fill. So the density can stay constant.
We’re finally finished with our foray through the stars beyond our sun. There’s more to explore, of course — soon enough, we’ll dive into star life cycles, as promised — but for now, let’s take a look at the space between the stars.


Did I blow your mind? 😉